Strategic Planning PowerPoint Templates, Presentation Slides & PPT Design
- Sub Categories
-
- 30 60 90 Day Plan
- About Us Company Details
- Action Plan
- Agenda
- Annual Report
- Audit Reports
- Balance Scorecard
- Brand Equity
- Business Case Study
- Business Communication Skills
- Business Plan Development
- Business Problem Solving
- Business Review
- Capital Budgeting
- Career Planning
- Change Management
- Color Palettes
- Communication Process
- Company Location
- Company Vision
- Compare
- Competitive Analysis
- Corporate Governance
- Cost Reduction Strategies
- Custom Business Slides
- Customer Service
- Dashboard
- Data Management
- Decision Making
- Digital Marketing Strategy
- Digital Transformation
- Disaster Management
- Diversity
- Equity Investment
- Financial Analysis
- Financial Services
- Financials
- Growth Hacking Strategy
- Human Resource Management
- Innovation Management
- Interview Process
- Knowledge Management
- Leadership
- Lean Manufacturing
- Legal Law Order
- Management
- Market Segmentation
- Marketing
- Media and Communication
- Meeting Planner
- Mergers and Acquisitions
- Metaverse
- Newspapers
- Operations and Logistics
- Organizational Structure
- Our Goals
- Performance Management
- Pitch Decks
- Pricing Strategies
- Process Management
- Product Development
- Product Launch Ideas
- Product Portfolio
- Project Management
- Purchasing Process
- Quality Assurance
- Quotes and Testimonials
- Real Estate
- Risk Management
- Sales Performance Plan
- Sales Review
- SEO
- Service Offering
- Six Sigma
- Social Media and Network
- Software Development
- Solution Architecture
- Stock Portfolio
- Strategic Management
- Strategic Planning
- Supply Chain Management
- Swimlanes
- System Architecture
- Team Introduction
- Testing and Validation
- Thanks-FAQ
- Time Management
- Timelines Roadmaps
- Value Chain Analysis
- Value Stream Mapping
- Workplace Ethic
-
 Energy efficiency with three arrows and energy symbol
Presenting energy efficiency with three arrows and energy symbol. This is a energy efficiency with three arrows and energy symbol. This is a three stage process. The stages in this process are energy efficiency, energy effectiveness, power efficiency.
-
 Hourglass simple icon sand empty icon
Presenting hourglass simple icon sand empty icon. This is a hourglass simple icon sand empty icon. This is a one stage process. The stages in this process are hourglass, sand timer, sand clock.
-
 Hourglass simple tilt eight shape icon
Presenting hourglass simple tilt eight shape icon. This is a hourglass simple tilt eight shape icon. This is a one stage process. The stages in this process are hourglass, sand timer, sand clock.
-
 Hourglass under the blue circular icon
Presenting Hourglass Under The Blue Circular Icon. Get this fully customizable template and view it on widescreen without any fear of pixelation. It can also be downloaded on a standard screen. Convert it into PDF, JPG, and PNG formats. This slide is entirely compatible with Google Slides. You are free to change anything in this slide. Modify the colors, background, text size, and style as per your requirements to deliver engaging presentations in no time.
-
 Hourglass under the circular arrow icon
Presenting hourglass under the circular arrow icon. This is a hourglass under the circular arrow icon. This is a one stage process. The stages in this process are hourglass, sand timer, sand clock.
-
 Hourglass under the round glass structure icon
Presenting hourglass under the round glass structure icon. This is a hourglass under the round glass structure icon. This is a one stage process. The stages in this process are hourglass, sand timer, sand clock.
-
 Hourglass with clock at bottom icon
Presenting hourglass with clock at bottom icon. This is a hourglass with clock at bottom icon. This is a one stage process. The stages in this process are hourglass, sand timer, sand clock.
-
 Hourglass with half lines design icon
Presenting hourglass with half lines design icon. This is a hourglass with half lines design icon. This is a one stage process. The stages in this process are hourglass, sand timer, sand clock.
-
 Hourglass with sand particles inside icon
Presenting hourglass with sand particles inside icon. This is a hourglass with sand particles inside icon. This is a one stage process. The stages in this process are hourglass, sand timer, sand clock.
-
 Customer acquisition cost powerpoint graphics
Presenting customer acquisition cost powerpoint graphics. This is a customer acquisition cost powerpoint graphics. This is a three stage process. The stages in this process are team composition, average cost per person, on target earnings, salary cost, salary overhead.
-
 Job description presentation pictures
Presenting job description presentation pictures. This is a job description presentation pictures. This is a three stage process. The stages in this process are desired profile, qualification, skills required.
-
 Magnifying glass presentation powerpoint templates
Presenting magnifying glass presentation powerpoint templates. This is a magnifying glass presentation powerpoint templates. This is a one stage process. The stages in this process are business, marketing, flow, process, planning.
-
 Venn ppt example professional
Presenting venn ppt example professional. This is a venn ppt example professional. This is a three stage process. The stages in this process are venn, business, marketing, strategy, process.
-
 Strategic positioning ppt diagrams template 1
Presenting strategic positioning ppt diagrams template 1. This is a strategic positioning ppt diagrams template 1. This is a three stage process. The stages in this process are superior quality, moderate prices, customer value differentiation, focus on priorities.
-
 Brand mission statement powerpoint slide clipart
Presenting brand mission statement powerpoint slide clipart. This is a brand mission statement powerpoint slide clipart. This is a one stage process. The stages in this process are vision, mission, business, management, strategy.
-
 Brand product service powerpoint slide presentation tips
Presenting brand product service powerpoint slide presentation tips. This is a brand product service powerpoint slide presentation tips. This is a five stage process. The stages in this process are business, management, strategy, icons.
-
 Brand tracking product awareness ppt background designs
Presenting brand tracking product awareness ppt background designs. This is a brand tracking product awareness ppt background designs. This is a four stage process. The stages in this process are ad awareness, brand awareness, preference, latest purchase, mobile.
-
 Brand value ppt examples professional
Presenting brand value ppt examples professional. This is a brand value ppt examples professional. This is a four stage process. The stages in this process are business, management, strategy, value, icons.
-
 Establish brand positioning ppt sample presentations
Presenting establish brand positioning ppt sample presentations. This is a establish brand positioning ppt sample presentations. This is a three stage process. The stages in this process are tenderness, target customers, key benefits, price, company and product.
-
 Promotion external powerpoint slide background designs
Presenting promotion external powerpoint slide background designs. This is a promotion external powerpoint slide background designs. This is a three stage process. The stages in this process are paid media, earned media, advertising, sharing, web properties.
-
 Venn powerpoint slide presentation examples
Presenting venn powerpoint slide presentation examples. This is a venn powerpoint slide presentation examples. This is a four stage process. The stages in this process are venn, business, planning, marketing.
-
 Blue binoculars design with yellow background
Presenting blue binoculars design with yellow background. This is a blue binoculars design with yellow background. This is a one stage process. The stages in this process are telescope, binoculars icon, magnifying glass.
-
 Grey binoculars icon with green background
Presenting grey binoculars icon with green background. This is a grey binoculars icon with green background. This is a one stage process. The stages in this process are telescope, binoculars icon, magnifying glass.
-
 Orange black binoculars with black background
Presenting orange black binoculars with black background. This is a orange black binoculars with black background. This is a one stage process. The stages in this process are telescope, binoculars icon, magnifying glass.
-
 White binoculars design with blue background
Presenting white binoculars design with blue background. This is a white binoculars design with blue background. This is a one stage process. The stages in this process are telescope, binoculars icon, magnifying glass.
-
 White binoculars design with blue circle background
Presenting white binoculars design with blue circle background. This is a white binoculars design with blue circle background. This is a one stage process. The stages in this process are telescope, binoculars icon, magnifying glass.
-
 White binoculars with green background
Presenting white binoculars with green background. This is a white binoculars with green background. This is a one stage process. The stages in this process are telescope, binoculars icon, magnifying glass.
-
 Market share research methodology with six pentagonal steps
Presenting market share research methodology with six pentagonal steps. This is a market share research methodology with six pentagonal steps. This is a six stage process. The stages in this process are research methodology, research method, research techniques.
-
 Market share research methodology with six steps
Presenting the Core Products Beneficial System template. The template supports both the standard and widescreen sizes. The slide is extremely easy to download and can be saved in the popular image or document formats such as JPEG and PDF. It is having compatibility with Google Slides and other office suites. Alter the style, size, and the background of the slides. High-quality graphics ensure that pixelation does not occur.
-
 Research analysis with design and develop process
Presenting Research Analysis With Design And Develop Process. The PPT is fully editable in MS PowerPoint and compatible with Google Slides. You can modify the font style, font color, and other attributes within seconds. Transform this template into numerous images or document formats such as JPEG or PDF. High-quality graphics ensure that quality is retained at all times. Both standard and widescreen sizes are supported.
-
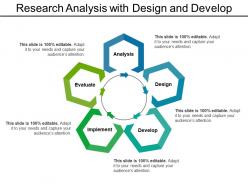 Research analysis with design and develop template 1
Presenting Research Analysis With Design And Develop Template 1 presentation. This PPT layout is compatible with Google Slides. You can download this PPT theme in various formats like PDF, PNG, and JPG. This PowerPoint template is completely editable and you can modify the font size, font type, and shapes as per your requirements. This PPT slide is available in 4:3 and 16:9 aspect ratios
-
 Research methodology showing identify aims test workflow
Presenting research methodology showing identify aims test workflow. This is a research methodology showing identify aims test workflow. This is a ten stage process. The stages in this process are research methodology, research method, research techniques.
-
 Research methodology with analysis and online survey
Presenting Research Methodology With Analysis And Online Survey template. The PPT is fully editable in MS PowerPoint and compatible with Google Slides. You can modify the font style, font color, and other attributes within seconds. Transform this template into numerous images or document formats such as JPEG or PDF. High-quality graphics ensure that quality is retained at all times. Both standard and widescreen sizes are supported.
-
 Research methodology with analysis template 1
Presenting research methodology with analysis template 1. This is a research methodology with analysis template 1. This is a six stage process. The stages in this process are research methodology, research method, research techniques.
-
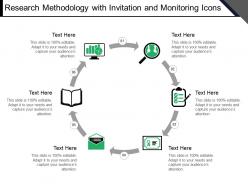 Research methodology with invitation and monitoring icons
Presenting research methodology with invitation and monitoring icons. This is a research methodology with invitation and monitoring icons. This is a six stage process. The stages in this process are research methodology, research method, research techniques.
-
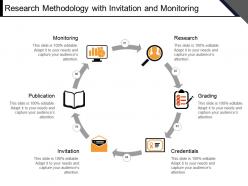 Research methodology with invitation and monitoring template 2
Presenting research methodology with invitation and monitoring template 2. This is a research methodology with invitation and monitoring template 2. This is a six stage process. The stages in this process are research methodology, research method, research techniques.
-
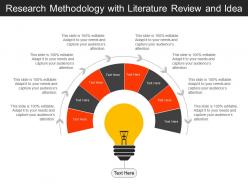 Research methodology with literature review and idea
Presenting the Research Methodology With Literature Review And Idea template. The template supports both the standard and widescreen sizes. The slide is extremely easy to download and can be saved in the popular image or document formats such as JPEG and PDF. It is having compatibility with Google Slides and other office suites. Alter the style, size, and the background of the slides. High-quality graphics ensure that pixelation does not occur.
-
 Research methodology with literature review and report findings
Presenting the Research Methodology With Literature Review And Report Findings template. The template supports both the standard and widescreen sizes. The slide is extremely easy to download and can be saved in the popular image or document formats such as JPEG and PDF. It is having compatibility with Google Slides and other office suites. Alter the style, size, and the background of the slides. High-quality graphics ensure that pixelation does not occur.
-
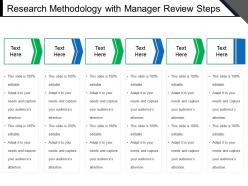 Research methodology with manager review steps
Presenting research methodology with manager review steps. This is a research methodology with manager review steps. This is a six stage process. The stages in this process are research methodology, research method, research techniques.
-
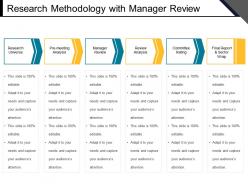 Research methodology with manager review template 2
Presenting research methodology with manager review template 2. This is a research methodology with manager review template 2. This is a six stage process. The stages in this process are research methodology, research method, research techniques.
-
 Research methodology with ten different steps
Presenting Research Methodology With Ten Different Steps. The PPT is fully editable in MS PowerPoint and compatible with Google Slides. You can modify the font style, font color, and other attributes within seconds. Transform this template into numerous images or document formats such as JPEG or PDF. High-quality graphics ensure that quality is retained at all times. Both standard and widescreen sizes are supported.
-
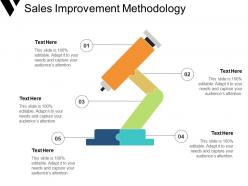 Sales improvement methodology
Introducing the Sales Improvement Methodology which is completely editable. The template is adaptable with Google Slides, which makes it accessible at once. Open and save your presentation into formats like PDF, JPG, and PNG. The slide is easily available in both 4:3 and 16:9 aspect ratios. You can change the colors, fonts, font size, and font types of the template as per the business requirements.
-
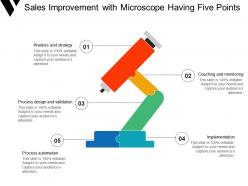 Sales improvement with microscope having five points
Presenting sales improvement with microscope having five points. This is a sales improvement with microscope having five points. This is a five stage process. The stages in this process are research methodology, research method, research techniques.
-
 Mind map powerpoint slide templates download
Introducing the Mind Map PowerPoint Slide Templates Download. The template is adaptable with Google Slides, which makes it accessible at once. Open and save your presentation into formats like PDF, JPG, and PNG. The slide is easily available in both 4:3 and 16:9 format. You can change the colors, fonts, font size, and font types of the template as per the business requirements.
-
 Assessment icon represented by document paper and pencil
Presenting assessment icon represented by document paper and pencil. This is a assessment icon represented by document paper and pencil. This is a three stage process. The stages in this process are feedback loop icon, evaluation icon, assessment icon.
-
 Assessment icon represented document paper inside hexagon
Presenting assessment icon represented document paper inside hexagon. This is a assessment icon represented document paper inside hexagon. This is a four stage process. The stages in this process are feedback loop icon, evaluation icon, assessment icon.
-
 Assessment icon represented document paper inside rounded square and silhouettes
Presenting assessment icon represented document paper inside rounded square and silhouettes. This is a assessment icon represented document paper inside rounded square and silhouettes. This is a two stage process. The stages in this process are feedback loop icon, evaluation icon, assessment icon.
-
 Assessment icon showcasing bar graph
Presenting assessment icon showcasing bar graph. This is a assessment icon showcasing bar graph. This is a three stage process. The stages in this process are feedback loop icon, evaluation icon, assessment icon.
-
 Assessment icon with document pencil badge a plus sign
Presenting assessment icon with document pencil badge a plus sign. This is a assessment icon with document pencil badge a plus sign. This is a three stage process. The stages in this process are feedback loop icon, evaluation icon, assessment icon.
-
 Assessment icon with magnifying glass bar graph silhouettes document
Presenting assessment icon with magnifying glass bar graph silhouettes document. This is a assessment icon with magnifying glass bar graph silhouettes document. This is a three stage process. The stages in this process are feedback loop icon, evaluation icon, assessment icon.
-
 Assessment icon with magnifying glass representing documents
Presenting assessment icon with magnifying glass representing documents. This is a assessment icon with magnifying glass representing documents. This is a three stage process. The stages in this process are feedback loop icon, evaluation icon, assessment icon.
-
 Assessment icon with magnifying glass showcasing bar graph
Presenting assessment icon with magnifying glass showcasing bar graph. This is a assessment icon with magnifying glass showcasing bar graph. This is a two stage process. The stages in this process are feedback loop icon, evaluation icon, assessment icon.
-
 Assessment icon with man silhouettes and clock
Presenting assessment icon with man silhouettes and clock. This is a assessment icon with man silhouettes and clock. This is a three stage process. The stages in this process are feedback loop icon, evaluation icon, assessment icon.
-
 Efficiency icon clock dollar screen checklist
Presenting efficiency icon clock dollar screen checklist. This is a efficiency icon clock dollar screen checklist. This is a four stage process. The stages in this process are efficiency icon, ability icon, effectiveness icon.
-
 Efficiency icon gear anti clockwise arrows
Presenting efficiency icon gear anti clockwise arrows. This is a efficiency icon gear anti clockwise arrows. This is a two stage process. The stages in this process are efficiency icon, ability icon, effectiveness icon.
-
 Efficiency icon represented by gear and overlapping speedometer performance
Presenting efficiency icon represented by gear and overlapping speedometer performance. This is a efficiency icon represented by gear and overlapping speedometer performance. This is a three stage process. The stages in this process are efficiency icon, ability icon, effectiveness icon.
-
 Efficiency icon represented by gear concentric circle and central check mark performance
Presenting efficiency icon represented by gear concentric circle and central check mark performance. This is a efficiency icon represented by gear concentric circle and central check mark performance. This is a three stage process. The stages in this process are efficiency icon, ability icon, effectiveness icon.
-
 Efficiency icon represented by red grey concentric circles forming speedometer arrow
Presenting efficiency icon represented by red grey concentric circles forming speedometer arrow. This is a efficiency icon represented by red grey concentric circles forming speedometer arrow. This is a two stage process. The stages in this process are efficiency icon, ability icon, effectiveness icon.
-
 Efficiency icon represented by two overlapping gears and bar graph performance
Presenting efficiency icon represented by two overlapping gears and bar graph performance. This is a efficiency icon represented by two overlapping gears and bar graph performance. This is a three stage process. The stages in this process are efficiency icon, ability icon, effectiveness icon.
-
 Efficiency icon semi gear pointing arrow
Presenting efficiency icon semi gear pointing arrow. This is a efficiency icon semi gear pointing arrow. This is a three stage process. The stages in this process are efficiency icon, ability icon, effectiveness icon.
-
Excellent template with unique design.
-
Visually stunning presentation, love the content.
-
Excellent work done on template design and graphics.
-
Best way of representation of the topic.
-
Innovative and attractive designs.
-
Best way of representation of the topic.
-
It saves your time and decrease your efforts in half.
-
Awesome presentation, really professional and easy to edit.
-
Unique research projects to present in meeting.
-
Graphics are very appealing to eyes.


