Powerpoint Templates and Google slides for Cycle Time KPIs
Save Your Time and attract your audience with our fully editable PPT Templates and Slides.
-
 Kpi Analytics Dashboard With Procurement Cycle Time
Following slide shows the key performance indicator KPI dashboard which will assist corporates to effectively monitor procurement process. The metrics are number of suppliers, contract compliance, average procurement cycle time, etc. Introducing our Kpi Analytics Dashboard With Procurement Cycle Time set of slides. The topics discussed in these slides are Analytics, Dashboard, Procurement. This is an immediately available PowerPoint presentation that can be conveniently customized. Download it and convince your audience.
-
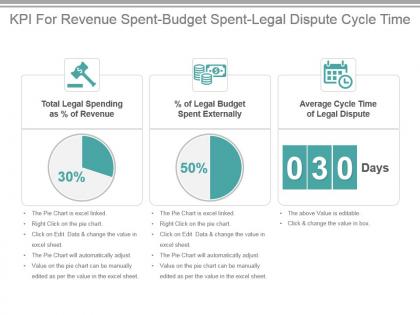
 Kpi for revenue spent budget spent legal dispute cycle time presentation slide
Presenting kpi for revenue spent budget spent legal dispute cycle time presentation slide. This presentation slide shows three Key Performance Indicators or KPIs in a Dashboard style design. The first KPI that can be shown is Total Legal Spending as percentage of Revenue. The second KPI is percentage of Legal Budget Spent Externally and the third is Average Cycle Time of Legal Dispute. These KPI Powerpoint graphics are all data driven,and the shape automatically adjusts according to your data. Just right click on the KPI graphic,enter the right value and the shape will adjust automatically. Make a visual impact with our KPI slides.
-
 Supply chain kpi for cycle cash time on time ship rate fill rate powerpoint slide
Presenting supply chain kpi for cycle cash time on time ship rate fill rate powerpoint slide. This presentation slide shows three Key Performance Indicators or KPIs in a Dashboard style design. The first KPI that can be shown is Cash To Cash Cycle Time. The second KPI is On Time Ship Rate and the third is Fill Rate. These KPI Powerpoint graphics are all data driven, and the shape automatically adjusts according to your data. Just right click on the KPI graphic, enter the right value and the shape will adjust automatically. Make a visual impact with our KPI slides.
-
 Supply chain kpi for safety stock backorders order cycle time presentation slide
Presenting supply chain kpi for safety stock backorders order cycle time presentation slide. This presentation slide shows three Key Performance Indicators or KPIs in a Dashboard style design. The first KPI that can be shown is Size of Safety Stock. The second KPI is percentage of Backorders and the third is Customer Order Cycle Time. These KPI Powerpoint graphics are all data driven, and the shape automatically adjusts according to your data. Just right click on the KPI graphic, enter the right value and the shape will adjust automatically. Make a visual impact with our KPI slides.
-
 Kpi for patient cost nosocomial infection hospital beds cycle time powerpoint slide
Presenting kpi for patient cost nosocomial infection hospital beds cycle time powerpoint slide. This presentation slide shows three Key Performance Indicators or KPIs in a Dashboard style design. The first KPI that can be shown is Cost Per Patient Day. The second KPI is percentage of Nosocomial Infection and the third is Average Cycle Time of Hospital Beds. These KPI Powerpoint graphics are all data driven, and the shape automatically adjusts according to your data. Just right click on the KPI graphic, enter the right value and the shape will adjust automatically. Make a visual impact with our KPI slides.
-
 Kpi for inventory replenishment cycle time average unit cost presentation slide
Presenting kpi for inventory replenishment cycle time average unit cost presentation slide. This presentation slide shows two Key Performance Indicators or KPIs in a Dashboard style design. The first KPI that can be shown is Inventory Replenishment Cycle Time. The second KPI is Average Unit Cost. These KPI Powerpoint graphics are all data driven, and the shape automatically adjusts according to your data. Just right click on the KPI graphic, enter the right value and the shape will adjust automatically. Make a visual impact with our KPI slides.
-
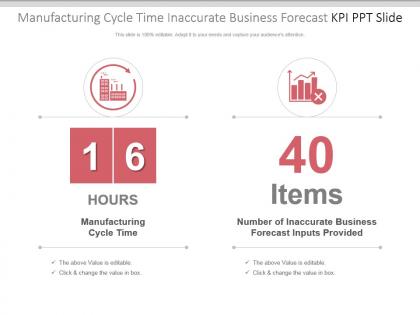
 Manufacturing cycle time inaccurate business forecast kpi ppt slide
Presenting manufacturing cycle time inaccurate business forecast kpi ppt slide. This presentation slide shows two Key Performance Indicators or KPIs in a Dashboard style design. The first KPI that can be shown is Manufacturing Cycle Time. The second KPI is Number of Inaccurate Business Forecast Inputs Provided. These KPI Powerpoint graphics are all data driven, and the shape automatically adjusts according to your data. Just right click on the KPI graphic, enter the right value and the shape will adjust automatically. Make a visual impact with our KPI slides.
-
 Vendor kpi dashboard showing supplier compliance stats and procurement cycle time
Presenting this set of slides with name - Vendor Kpi Dashboard Showing Supplier Compliance Stats And Procurement Cycle Time. This is a four stage process. The stages in this process are Vendor, Supplier, Retailer.
-
 Cycle time kpi for pick to ship supplier delivery ppt slide
Presenting cycle time kpi for pick to ship supplier delivery ppt slide. This presentation slide shows Two Key Performance Indicators or KPIs in a Dashboard style design. The first KPI that can be shown is Customer Order Pick to Ship Cycle Time. The second KPI is Supplier Delivery Dock to Stock Cycle Time. These KPI Powerpoint graphics are all data driven, and the shape automatically adjusts according to your data. Just right click on the KPI graphic, enter the right value and the shape will adjust automatically. Make a visual impact with our KPI slides.
-
 Neglected orders kpi for mean time and order cycle ppt slide
Presenting neglected orders kpi for mean time and order cycle ppt slide. This presentation slide shows two Key Performance Indicators or KPIs. The first KPI that can be show is Mean Time Order to Activation. The second KPI is Order Cycle, Order Receipt to Entry. These KPI Powerpoint graphics are all data driven, and the shape automatically adjusts according to your data. Just right click on the KPI graphic, enter the right value and the shape will adjust automatically. Make a visual impact with our KPI slides.


