Powerpoint Templates and Google slides for Analytics Graph
Save Your Time and attract your audience with our fully editable PPT Templates and Slides.
-
 Brand Analytics Company Profile Global Partners Ppt Professional Graphics Template Cp Ss V
The slide highlights the international business partners for Kantar company. The partners included global partners, local giants, specialty partners and technology partners Deliver an outstanding presentation on the topic using this Brand Analytics Company Profile Global Partners Ppt Professional Graphics Template Cp Ss V. Dispense information and present a thorough explanation of Specialties, Governments, Technology using the slides given. This template can be altered and personalized to fit your needs. It is also available for immediate download. So grab it now.
-
 Brand Analytics Company Profile Global Presence Ppt Professional Graphics Pictures Cp Ss V
The slide illustrates worldwide presence of the Kantar company. It shows the company offices in north America, latin America, Europe, MEA middle east and Africa, and Asia pacific Present the topic in a bit more detail with this Brand Analytics Company Profile Global Presence Ppt Professional Graphics Pictures Cp Ss V. Use it as a tool for discussion and navigation on Global Presence, Illustrates, Worldwide. This template is free to edit as deemed fit for your organization. Therefore download it now.
-
 Brand Analytics Company Profile Government And Public Industry Ppt Professional Graphics Example Cp Ss V
The following slide highlights the research services offered by Kantar company to the government and public sector industry. It also shows the clients and impact of solutions provided Deliver an outstanding presentation on the topic using this Brand Analytics Company Profile Government And Public Industry Ppt Professional Graphics Example Cp Ss V. Dispense information and present a thorough explanation of Government, Environment, Service using the slides given. This template can be altered and personalized to fit your needs. It is also available for immediate download. So grab it now.
-
 Cybernetics Overview Of Data Analytics Categories Ppt Show Graphics Example
This slide shows descriptive, diagnostic, predictive, prescriptive data analytics. The purpose of this slide is to explain the categories of data analytics and method used to represent them. Present the topic in a bit more detail with this Cybernetics Overview Of Data Analytics Categories Ppt Show Graphics Example. Use it as a tool for discussion and navigation on Descriptive, Diagnostic, Predictive. This template is free to edit as deemed fit for your organization. Therefore download it now.
-
 Brand Analytics Company Profile Retail Industry Ppt Portfolio Graphics Tutorials Cp Ss V
The following slide highlights the research services offered by Kantar company to the retail industry. It also shows the clients and impact of solutions provided Present the topic in a bit more detail with this Brand Analytics Company Profile Retail Industry Ppt Portfolio Graphics Tutorials Cp Ss V. Use it as a tool for discussion and navigation on Product, Innovation, Strategy Incremental. This template is free to edit as deemed fit for your organization. Therefore download it now.
-
 Brand Analytics Company Profile Sport And Leisure Industry Ppt Portfolio Graphics Template Cp Ss V
The following slide highlights the research services offered by Kantar company to the sport and leisure industry. It also shows the clients and impact of solutions provided Deliver an outstanding presentation on the topic using this Brand Analytics Company Profile Sport And Leisure Industry Ppt Portfolio Graphics Template Cp Ss V. Dispense information and present a thorough explanation of Awareness, Effectiveness, Entertainment using the slides given. This template can be altered and personalized to fit your needs. It is also available for immediate download. So grab it now.
-
 Brand Analytics Company Profile Table Of Contents Ppt Portfolio Graphics Download Cp Ss V
Present the topic in a bit more detail with this Brand Analytics Company Profile Table Of Contents Ppt Portfolio Graphics Download Cp Ss V. Use it as a tool for discussion and navigation on Executive Summary, Company Overview, Business Divisions. This template is free to edit as deemed fit for your organization. Therefore download it now.
-
 Agenda For Predictive Analytics Techniques Ppt Powerpoint Presentation File Graphics
Introducing Agenda For Predictive Analytics Techniques Ppt Powerpoint Presentation File Graphics to increase your presentation threshold. Encompassed with six stages, this template is a great option to educate and entice your audience. Dispence information on Comparison, Overview, Understand, using this template. Grab it now to reap its full benefits.
-
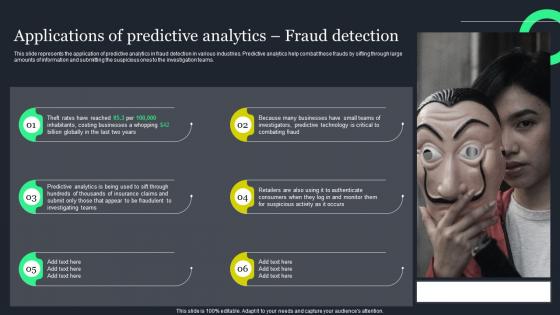 Applications Of Predictive Analytics Fraud Ppt Powerpoint Presentation Diagram Graph Charts
This slide represents the application of predictive analytics in fraud detection in various industries. Predictive analytics help combat these frauds by sifting through large amounts of information and submitting the suspicious ones to the investigation teams. Increase audience engagement and knowledge by dispensing information using Applications Of Predictive Analytics Fraud Ppt Powerpoint Presentation Diagram Graph Charts. This template helps you present information on six stages. You can also present information on Businesses, Investigators, Technology using this PPT design. This layout is completely editable so personaize it now to meet your audiences expectations.
-
 Predictive Analytics Vs Machine Learning Ppt Powerpoint Presentation File Graphics
This slide represents the comparison between predictive analytics and machine learning based on technology used and built on, the functionality of the model, and requirements for the development of the models. Increase audience engagement and knowledge by dispensing information using Predictive Analytics Vs Machine Learning Ppt Powerpoint Presentation File Graphics. This template helps you present information on two stages. You can also present information on Predictive Analytics, Machine Learning using this PPT design. This layout is completely editable so personaize it now to meet your audiences expectations.
-
 Different Types Of Iot Data Analytics Iot Data Analytics Ppt Professional Graphics Tutorials
This slide highlight different types of IoT data analytics. The purpose of this slide is to graphically differentiate between four types of analytics which are descriptive, diagnostic, predictive and prescriptive. Deliver an outstanding presentation on the topic using this Different Types Of Iot Data Analytics Iot Data Analytics Ppt Professional Graphics Tutorials. Dispense information and present a thorough explanation of Analytics, Identifying, Visualizing Historical using the slides given. This template can be altered and personalized to fit your needs. It is also available for immediate download. So grab it now.
-
 F1379 Iot Data Analytics For Table Of Contents Ppt Show Graphics Download
Introducing F1379 Iot Data Analytics For Table Of Contents Ppt Show Graphics Download to increase your presentation threshold. Encompassed with one stages, this template is a great option to educate and entice your audience. Dispence information on Architecture, Data Analytics, Management, using this template. Grab it now to reap its full benefits.
-
 Table Of Contents Iot Data Analytics Ppt Show Graphics Template
Introducing Table Of Contents Iot Data Analytics Ppt Show Graphics Template to increase your presentation threshold. Encompassed with one stages, this template is a great option to educate and entice your audience. Dispence information on Internet Of Things, Key Requirements, Analytics Applications, using this template. Grab it now to reap its full benefits.
-
 Overview Of Predictive Analytics Framework Ppt Styles Graphics Pictures
This slide outlines the overview of the predictive analytics framework and its components, including wide area network, OpenFlow, forecasting, software defined networking controller, predictive models, elastic cluster, data acquisition and application servers. Deliver an outstanding presentation on the topic using this Overview Of Predictive Analytics Framework Ppt Styles Graphics Pictures. Dispense information and present a thorough explanation of Openflow, Forecast, Sdn Controller using the slides given. This template can be altered and personalized to fit your needs. It is also available for immediate download. So grab it now.
-
 Tools Used For Predictive Analytics Ppt Professional Graphics Pictures
This slide depicts the tools used for predictive analytics to perform operations in predictive models. These tools include SPSS statistics, SAS advanced analytics, SAP predictive analytics, TIBCO Statistica, H2O, and Q research. Increase audience engagement and knowledge by dispensing information using Tools Used For Predictive Analytics Ppt Professional Graphics Pictures.This template helps you present information on six stages. You can also present information on Ibm Spss Statistics, Tibco Statistica, Q Research using this PPT design. This layout is completely editable so personaize it now to meet your audiences expectations.
-
 Introduction To Predictive Analytics Workflow Prospective Analysis Ppt Graphics
This slide represents the predictive analytics workflow that is widely used in managing energy loads in electric grids. It includes accessing and exploring information, pre processing data, developing predictive models, and integrating analytics with systems. Increase audience engagement and knowledge by dispensing information using Introduction To Predictive Analytics Workflow Prospective Analysis Ppt Graphics. This template helps you present information on four stages. You can also present information on Information, Process, Models using this PPT design. This layout is completely editable so personaize it now to meet your audiences expectations.
-
 Link building article page rank analytics ppt icons graphics
Presenting link building article page rank analytics ppt icons graphics. This Power Point icon template has been crafted with graphic of four technology icons. This icon template contains the concept of link building and page rank analysis. Use this icon template diagram for marketing and web related presentations.
-
 Link building page rank strategy for victory analytics ppt icons graphics
Presenting link building page rank strategy for victory analytics ppt icons graphics. This Power Point icon template has been crafted with graphic of web icons. This icon template contains the concept of search engine optimization and mobile marketing. Use this icon template diagram for marketing and web related presentations.
-
 Business data analytics process presentation graphics
Presenting business data analytics process presentation graphics. This is a business data analytics process presentation graphics. This is a four stage process. The stages in this process are decision, insight, data, info.
-
 Data analytics process icon showing laptop with graph symbol
Presenting this set of slides with name - Data Analytics Process Icon Showing Laptop With Graph Symbol. This is a three stage process. The stages in this process are Data Analytics Process, Data Analysis Cycle, Data Visualization Process.
-
 Data analytics process icon showing magnifying glass with graphs
Presenting this set of slides with name - Data Analytics Process Icon Showing Magnifying Glass With Graphs. This is a two stage process. The stages in this process are Data Analytics Process, Data Analysis Cycle, Data Visualization Process.
-
 Sales info graphics analytics board with trend line
Presenting this set of slides with name - Sales Info Graphics Analytics Board With Trend Line. This is a two stage process. The stages in this process are Sales Infographic, Conversions Infographic, Leads Infographic.
-
 Business challenges and solutions showing by bulls eye and analytic graph
Presenting this set of slides with name - Business Challenges And Solutions Showing By Bulls Eye And Analytic Graph. This is a two stage process. The stages in this process are Challenges And Solutions, Issues And Solutions, Problem And Solution.
-
 Mobile analytics having bar graph and arrow upward
Presenting this set of slides with name - Mobile Analytics Having Bar Graph And Arrow Upward. This is a four stage process. The stages in this process are Mobile Analytics, Mobile Tracking, Mobile Web Analytics.
-
 Mobile analytics icon having bar graph
Presenting this set of slides with name - Mobile Analytics Icon Having Bar Graph. This is a one stage process. The stages in this process are Mobile Analytics, Mobile Tracking, Mobile Web Analytics.
-
 Mobile analytics icon having bar graph and arrow upward
Presenting this set of slides with name - Mobile Analytics Icon Having Bar Graph And Arrow Upward. This is a three stage process. The stages in this process are Mobile Analytics, Mobile Tracking, Mobile Web Analytics.
-
 Mobile analytics icon having bar graph and dollar
Presenting this set of slides with name - Mobile Analytics Icon Having Bar Graph And Dollar. This is a four stage process. The stages in this process are Mobile Analytics, Mobile Tracking, Mobile Web Analytics.
-
 Mobile analytics icon showing pie chart bar graph data analytics
Presenting this set of slides with name - Mobile Analytics Icon Showing Pie Chart Bar Graph Data Analytics. This is a one stage process. The stages in this process are Mobile Analytics, Mobile Tracking, Mobile Web Analytics.
-
 Mobile analytics showing target globe and bar graph
Presenting this set of slides with name - Mobile Analytics Showing Target Globe And Bar Graph. This is a seven stage process. The stages in this process are Mobile Analytics, Mobile Tracking, Mobile Web Analytics.
-
 Analysis with bar graph pie chart key factors highlighting business analytics
Presenting analysis with bar graph pie chart key factors highlighting business analytics. This is a analysis with bar graph pie chart key factors highlighting business analytics. This is a two stage process. The stages in this process are analysis, audit, investigation.
-
 Analysis with magnifying glass bar graph chart highlighting business analytics
Presenting analysis with magnifying glass bar graph chart highlighting business analytics. This is a analysis with magnifying glass bar graph chart highlighting business analytics. This is a three stage process. The stages in this process are analysis, audit, investigation.
-
 Data analytic bar graph magnifying glass
Presenting data analytic bar graph magnifying glass. This is a data analytic bar graph magnifying glass. This is a four stage process. The stages in this process are data analytics icons, information analytics icons, content analytics icons.
-
 Data analytic icon bar graph
Presenting Data Analytic Icon Bar Graph template. The slide is compatible with Google Slides which makes it accessible at once. The slide is completely editable. It can be saved in various document formats such as JPEG, PNG, or PDF. Moreover, both standard screen(4:3) and widescreen(16:9) aspect ratios are supported. High-quality graphics ensure that distortion does not occur.
-
 Data analytic icon computer screen bar graph
Presenting data analytic icon computer screen bar graph. This is a data analytic icon computer screen bar graph. This is a one stage process. The stages in this process are data analytics icons, information analytics icons, content analytics icons.
-
 Data analytic icon improved bar graph
Presenting data analytic icon improved bar graph. This is a data analytic icon improved bar graph. This is a three stage process. The stages in this process are data analytics icons, information analytics icons, content analytics icons.
-
 Data analytic magnifying glass bar graph
Presenting data analytic magnifying glass bar graph. This is a data analytic magnifying glass bar graph. This is a one stage process. The stages in this process are data analytics icons, information analytics icons, content analytics icons.
-
 Data analytic magnifying glass pie chart bar graph
Presenting data analytic magnifying glass pie chart bar graph. This is a data analytic magnifying glass pie chart bar graph. This is a four stage process. The stages in this process are data analytics icons, information analytics icons, content analytics icons.
-
 Data analytic screen growth improvement bar graph
Presenting data analytic screen growth improvement bar graph. This is a data analytic screen growth improvement bar graph. This is a two stage process. The stages in this process are data analytics icons, information analytics icons, content analytics icons.
-
 Market analytics icon with magnifying glass and bar graph
Presenting this set of slides with name - Market Analytics Icon With Magnifying Glass And Bar Graph. This is a four stage process. The stages in this process are Marketing Analytics, Marketing Performance, Marketing Discovery.
-
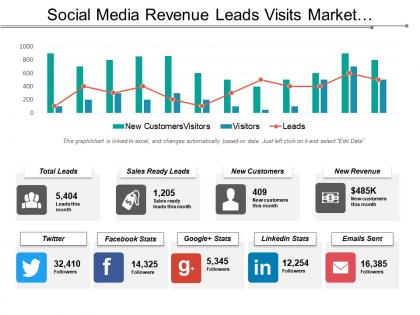 Social media revenue leads visits market analytics table with graph
Presenting this set of slides with name - Social Media Revenue Leads Visits Market Analytics Table With Graph. This is a three stage process. The stages in this process are Marketing Analytics, Marketing Performance, Marketing Discovery.
-
 Predictive analytics steps ppt summary graphics pictures
Presenting this set of slides with name - Predictive Analytics Steps Ppt Summary Graphics Pictures. This is a six stage process. The stages in this process are Define Project, Benefits, Stages, Statistics, Data Analysis.
-
 Analytics capability maturity model ppt powerpoint presentation outline graphics tutorials cpb
Presenting this set of slides with name - Analytics Capability Maturity Model Ppt Powerpoint Presentation Gallery Show Cpb. This is an editable four stages graphic that deals with topics like Analytics Capability Maturity Model to help convey your message better graphically. This product is a premium product available for immediate download, and is 100 percent editable in Powerpoint. Download this now and use it in your presentations to impress your audience.
-
 Data marketing analytics ppt powerpoint presentation gallery graphics download cpb
Presenting this set of slides with name - Data Marketing Analytics Ppt Powerpoint Presentation Gallery Graphics Download Cpb. This is an editable four stages graphic that deals with topics like Data Marketing Analytics to help convey your message better graphically. This product is a premium product available for immediate download, and is 100 percent editable in Powerpoint. Download this now and use it in your presentations to impress your audience.
-
 Analytics visualization mashup ppt powerpoint presentation icon graphics design cpb
Presenting this set of slides with name - Analytics Visualization Mashup Ppt Powerpoint Presentation Icon Graphics Design Cpb. This is an editable four stages graphic that deals with topics like Analytics Visualization Mashup to help convey your message better graphically. This product is a premium product available for immediate download, and is 100 percent editable in Powerpoint. Download this now and use it in your presentations to impress your audience.
-
 Bar chart and dot graph analytics icon
Presenting this set of slides with name - Bar Chart And Dot Graph Analytics Icon. This is a three stage process. The stages in this process are Bar Chart Icon, Bar Graph Icon, Data Chart Icon.
-
 Sales analytics marketing metrics ppt powerpoint presentation file graphics template cpb
Presenting this set of slides with name - Sales Analytics Marketing Metrics Ppt Powerpoint Presentation File Graphics Template Cpb. This is an editable five stages graphic that deals with topics like Sales Analytics Marketing Metrics to help convey your message better graphically. This product is a premium product available for immediate download, and is 100 percent editable in Powerpoint. Download this now and use it in your presentations to impress your audience.
-
 Sales marketing analytics ppt powerpoint presentation file graphics tutorials cpb
Presenting this set of slides with name - Sales Marketing Analytics Ppt Powerpoint Presentation File Graphics Tutorials Cpb. This is an editable four stages graphic that deals with topics like Sales Marketing Analytics to help convey your message better graphically. This product is a premium product available for immediate download, and is 100 percent editable in Powerpoint. Download this now and use it in your presentations to impress your audience.
-
 Pharmaceutical analytics ppt powerpoint presentation slides graphics tutorials cpb
Presenting this set of slides with name - Pharmaceutical Analytics Ppt Powerpoint Presentation Slides Graphics Tutorials Cpb. This is an editable four stages graphic that deals with topics like Pharmaceutical Analytics to help convey your message better graphically. This product is a premium product available for immediate download, and is 100 percent editable in Powerpoint. Download this now and use it in your presentations to impress your audience.
-
 Digital analytics ppt powerpoint presentation icon graphic images cpb
Presenting this set of slides with name - Digital Analytics Ppt Powerpoint Presentation Icon Graphic Images Cpb. This is an editable five stages graphic that deals with topics like Digital Analytics to help convey your message better graphically. This product is a premium product available for immediate download, and is 100 percent editable in Powerpoint. Download this now and use it in your presentations to impress your audience.
-
 Big data analytics ppt powerpoint presentation gallery graphics cpb
Presenting this set of slides with name Big Data Analytics Ppt Powerpoint Presentation Gallery Graphics Cpb. This is an editable Powerpoint four stages graphic that deals with topics like Big Data Analytics to help convey your message better graphically. This product is a premium product available for immediate download and is 100 percent editable in Powerpoint. Download this now and use it in your presentations to impress your audience.
-
 Media measurement analytics ppt powerpoint presentation summary graphics design cpb
Presenting this set of slides with name Media Measurement Analytics Ppt Powerpoint Presentation Summary Graphics Design Cpb. This is an editable Powerpoint six stages graphic that deals with topics like Media Measurement Analytics to help convey your message better graphically. This product is a premium product available for immediate download and is 100 percent editable in Powerpoint. Download this now and use it in your presentations to impress your audience.
-
 Media mix analytics ppt powerpoint presentation summary graphic images cpb
Presenting this set of slides with name Media Mix Analytics Ppt Powerpoint Presentation Summary Graphic Images Cpb. This is an editable Powerpoint three stages graphic that deals with topics like Media Mix Analytics to help convey your message better graphically. This product is a premium product available for immediate download and is 100 percent editable in Powerpoint. Download this now and use it in your presentations to impress your audience.
-
 Marketing measurement analytics ppt powerpoint presentation ideas graphics pictures cpb
Presenting this set of slides with name Marketing Measurement Analytics Ppt Powerpoint Presentation Ideas Graphics Pictures Cpb. This is an editable Powerpoint six stages graphic that deals with topics like Marketing Measurement Analytics to help convey your message better graphically. This product is a premium product available for immediate download and is 100 percent editable in Powerpoint. Download this now and use it in your presentations to impress your audience.
-
 Marketing analytics ppt powerpoint presentation slides graphics pictures cpb
Presenting this set of slides with name Marketing Analytics Ppt Powerpoint Presentation Slides Graphics Pictures Cpb. This is an editable Powerpoint five stages graphic that deals with topics like Marketing Analytics to help convey your message better graphically. This product is a premium product available for immediate download and is 100 percent editable in Powerpoint. Download this now and use it in your presentations to impress your audience.
-
 Data analytics content marketing automation ppt powerpoint presentation model graphics cpb
Presenting this set of slides with name Data Analytics Content Marketing Automation Ppt Powerpoint Presentation Model Graphics Cpb. This is an editable Powerpoint three stages graphic that deals with topics like Data Analytics Content Marketing Automation to help convey your message better graphically. This product is a premium product available for immediate download and is 100 percent editable in Powerpoint. Download this now and use it in your presentations to impress your audience.
-
 Sales analytics metrics ppt powerpoint presentation model graphics cpb
Presenting this set of slides with name Sales Analytics Metrics Ppt Powerpoint Presentation Model Graphics Cpb. This is an editable Powerpoint five stages graphic that deals with topics like Sales Analytics Metrics to help convey your message better graphically. This product is a premium product available for immediate download and is 100 percent editable in Powerpoint. Download this now and use it in your presentations to impress your audience.
-
 Saas analytics ppt powerpoint presentation show graphics download cpb
Presenting this set of slides with name SaaS Analytics Ppt Powerpoint Presentation Show Graphics Download Cpb. This is an editable Powerpoint two stages graphic that deals with topics like SaaS Analytics to help convey your message better graphically. This product is a premium product available for immediate download and is 100 percent editable in Powerpoint. Download this now and use it in your presentations to impress your audience.
-
 Online retail store analytics strategy ppt powerpoint presentation gallery graphics cpb
Presenting this set of slides with name Online Retail Store Analytics Strategy Ppt Powerpoint Presentation Gallery Graphics Cpb. This is an editable Powerpoint three stages graphic that deals with topics like Online Retail Store Analytics Strategy to help convey your message better graphically. This product is a premium product available for immediate download, and is 100 percent editable in Powerpoint. Download this now and use it in your presentations to impress your audience.
-
 Data analytics visualization ppt powerpoint presentation professional graphics cpb
Presenting this set of slides with name Data Analytics Visualization Ppt Powerpoint Presentation Professional Graphics Cpb. This is an editable Powerpoint eight stages graphic that deals with topics like Data Analytics Visualization to help convey your message better graphically. This product is a premium product available for immediate download and is 100 percent editable in Powerpoint. Download this now and use it in your presentations to impress your audience.
-
 Web analytics planning ppt powerpoint presentation gallery graphics pictures cpb
Presenting this set of slides with name Web Analytics Planning Ppt Powerpoint Presentation Gallery Graphics Pictures Cpb. This is an editable Powerpoint five stages graphic that deals with topics like Web Analytics Planning to help convey your message better graphically. This product is a premium product available for immediate download and is 100 percent editable in Powerpoint. Download this now and use it in your presentations to impress your audience.


