Powerpoint Templates and Google slides for Analytics Graph
Save Your Time and attract your audience with our fully editable PPT Templates and Slides.
-
 4 ps of marketing scoring system data analytics marketing graphic
Deliver a lucid presentation by utilizing this 4 Ps Of Marketing Scoring System Data Analytics Marketing Graphic. Use it to present an overview of the topic with the right visuals, themes, shapes, and graphics. This is an expertly designed complete deck that reinforces positive thoughts and actions. Use it to provide visual cues to your audience and help them make informed decisions. A wide variety of discussion topics can be covered with this creative bundle such as Scoring System, Data Analytics, Marketing Graphic. All the sixteen slides are available for immediate download and use. They can be edited and modified to add a personal touch to the presentation. This helps in creating a unique presentation every time. Not only that, with a host of editable features, this presentation can be used by any industry or business vertical depending on their needs and requirements. The compatibility with Google Slides is another feature to look out for in the PPT slideshow.
-
 Improve Icon Analytics Graph Business Increase Performance Growth Evaluation Gears
It has PPT slides covering wide range of topics showcasing all the core areas of your business needs. This complete deck focuses on Improve Icon Analytics Graph Business Increase Performance Growth Evaluation Gears and consists of professionally designed templates with suitable graphics and appropriate content. This deck has total of twleve slides. Our designers have created customizable templates for your convenience. You can make the required changes in the templates like colour, text and font size. Other than this, content can be added or deleted from the slide as per the requirement. Get access to this professionally designed complete deck PPT presentation by clicking the download button below.
-
 Graph Illustrating Big Data Analytics Tools In E Commerce
This slide showcases the statistical graph highlighting big data analytics in e-commerce which helps an organization to understand best and most used tool by businesses. It include details such as records customers entire journey, provides in-depth understanding of markets behavior, etc. Introducing our Graph Illustrating Big Data Analytics Tools In E Commerce set of slides. The topics discussed in these slides are E-Commerce Businesses, Key Insights, Key Reasons. This is an immediately available PowerPoint presentation that can be conveniently customized. Download it and convince your audience.
-
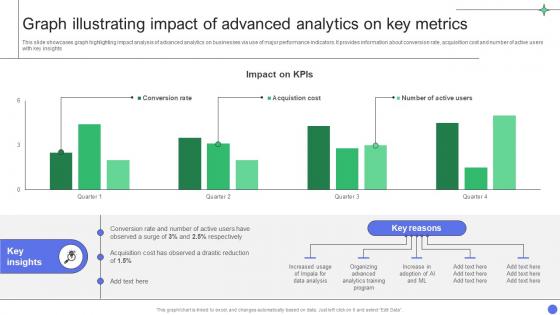 A Comprehensive Guide Graph Illustrating Impact Of Advanced Analytics On Key Metrics Data Analytics SS
This slide showcases graph highlighting impact analysis of advanced analytics on businesses via use of major performance indicators. It provides information about conversion rate, acquisition cost and number of active users with key insights Deliver an outstanding presentation on the topic using this A Comprehensive Guide Graph Illustrating Impact Of Advanced Analytics On Key Metrics Data Analytics SS Dispense information and present a thorough explanation of Drastic Reduction, Analytics Training Program, Data Analysis using the slides given. This template can be altered and personalized to fit your needs. It is also available for immediate download. So grab it now.
-
 Customer Retention Graph For Improved Navigating The Future Of Insurance Data Analytics SS
This slide outlines a graph highlighting trends in user retention of an ecommerce business. It covers details on lost customers, new users gained and net retention rate along with key insights. Present the topic in a bit more detail with this Customer Retention Graph For Improved Navigating The Future Of Insurance Data Analytics SS. Use it as a tool for discussion and navigation on Monthly Net Retention, Insurance Business, Excellent Customer Service. This template is free to edit as deemed fit for your organization. Therefore download it now.
-
 Analytics tools ecommerce ppt powerpoint presentation model graphics template cpb
Presenting Analytics Tools Ecommerce Ppt Powerpoint Presentation Model Graphics Template Cpb slide which is completely adaptable. The graphics in this PowerPoint slide showcase four stages that will help you succinctly convey the information. In addition, you can alternate the color, font size, font type, and shapes of this PPT layout according to your content. This PPT presentation can be accessed with Google Slides and is available in both standard screen and widescreen aspect ratios. It is also a useful set to elucidate topics like Analytics Tools Ecommerce. This well structured design can be downloaded in different formats like PDF, JPG, and PNG. So, without any delay, click on the download button now.
-
 Advanced Analytics Ppt Powerpoint Presentation Diagram Graph Charts
Presenting our set of slides with Advanced Analytics Ppt Powerpoint Presentation Diagram Graph Charts. This exhibits information on one stage of the process. This is an easy to edit and innovatively designed PowerPoint template. So download immediately and highlight information on Advanced Analytics.
-
 Visual Line Graph Analytics Icon
Presenting our set of slides with Visual Line Graph Analytics Icon. This exhibits information on three stages of the process. This is an easy to edit and innovatively designed PowerPoint template. So download immediately and highlight information on Visual Line Graph, Analytics Icon.
-
 Company Financial Data Growth Analytics Graph
Presenting our set of slides with Company Financial Data Growth Analytics Graph. This exhibits information on three stages of the process. This is an easy to edit and innovatively designed PowerPoint template. So download immediately and highlight information on Company Financial, Data Growth, Analytics Graph.
-
 Agenda For Big Data Analytics And Management Ppt Graphics
Increase audience engagement and knowledge by dispensing information using Agenda For Big Data Analytics And Management Ppt Graphics. This template helps you present information on five stages. You can also present information on Business Problems Associated, Provide Solutions To Problems, Know The Architecture using this PPT design. This layout is completely editable so personaize it now to meet your audiences expectations.
-
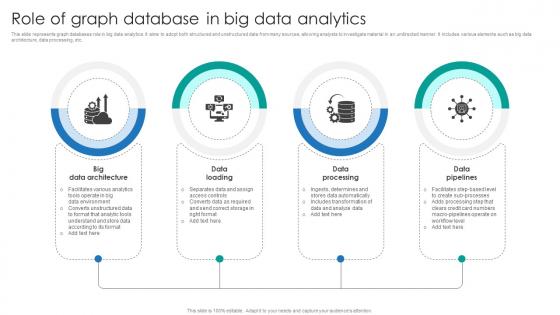 Role Of Graph Database In Big Data Analytics
This slide represents graph databases role in big data analytics. It aims to adopt both structured and unstructured data from many sources, allowing analysts to investigate material in an undirected manner. It includes various elements such as big data architecture, data processing, etc. Presenting our set of slides with Role Of Graph Database In Big Data Analytics. This exhibits information on four stages of the process. This is an easy to edit and innovatively designed PowerPoint template. So download immediately and highlight information on Big Data Architecture, Data Loading, Data Processing.
-
 Augmented Analytics Graph Icon Using AI
Presenting our set of slides with Augmented Analytics Graph Icon Using Ai This exhibits information on Three stages of the process. This is an easy to edit and innovatively designed PowerPoint template. So download immediately and highlight information on Augmented Analytics Graph Icon Using Ai
-
 Apt analytical crm graphical design ppt slides
Presenting apt analytical crm graphical design ppt slides. This is a analytical crm graphical design ppt slides. This is a six stage process. The stages in this process are customer acquisition, customer retention, customer information, cross selling, up-selling, retail current cutomers, offer key information to customers effectively.
-
 App analytical crm graphical design presentation pictures
Presenting app analytical crm graphical design presentation pictures. This is a analytical crm graphical design presentation pictures. This is a three stage process. The stages in this process are customer acquisition, customer retention, customer information.
-
 Portfolio risk and performance analytics graph ppt design
Presenting portfolio risk and performance analytics graph ppt design. This is a portfolio risk and performance analytics graph ppt design. This is a eight stage process. The stages in this process are mandate inputs, investment selection, investment selection, fund and security selection, strategic asset allocation, tactical asset allocation, portfolio review, portfolio construction.
-
 Marketing analytics sales automation powerpoint graphics
Presenting marketing analytics sales automation powerpoint graphics. Presenting marketing analytics sales automation powerpoint graphics. Presenting marketing analytics sales automation powerpoint graphics. This is a marketing analytics sales automation powerpoint graphics. This is a five stage process. The stages in this process are social media marketing, sales automation, email marketing, marketing analytics, content management.
-
 Retail analytics solution diagram powerpoint slide graphics
Presenting retail analytics solution diagram powerpoint slide graphics. Presenting retail analytics solution diagram powerpoint slide graphics. This is a retail analytics solution diagram powerpoint slide graphics. This is a eight stage process. The stages in this process are competitor prices and promotions, competitors product assortment, supermarkets ecommerce, optimization, stock ageing, target variances, promotion effectiveness.
-
 Objective of web analytics diagram presentation graphics
Presenting objective of web analytics diagram presentation graphics. This is a objective of web analytics diagram presentation graphics. This is a five stage process. The stages in this process are bench marketing, implement, social media, operations, management.
-
 Portfolio risk and performance analytics graph ppt sample file
Presenting portfolio risk and performance analytics graph ppt sample file. This is a portfolio risk and performance analytics graph ppt sample file. This is a six stage process. The stages in this process are monitoring and rebalancing, investment selection, mandate inputs, portfolio review, strategic asset allocation, fund and security selection, essentials of portfolio.
-
 Real time analytics docsend investor funding elevator ppt professional graphics template
This slide shows DocSends real time analytics which includes visitors engagement. Deliver an outstanding presentation on the topic using this Real Time Analytics Docsend Investor Funding Elevator Ppt Professional Graphics Template. Dispense information and present a thorough explanation of Real Time Analytics using the slides given. This template can be altered and personalized to fit your needs. It is also available for immediate download. So grab it now.
-
 Web Analytics Audit Report Digital Audit To Evaluate Brand Ppt Graphics
This slide highlights the web analytics audit report with website conversation rate, type of website visitors, site traffic website open rate by browser and purchase by device type. Present the topic in a bit more detail with this Web Analytics Audit Report Digital Audit To Evaluate Brand Ppt Graphics. Use it as a tool for discussion and navigation on Website Conversion, Conversion Rate, Type Of Website Visitors. This template is free to edit as deemed fit for your organization. Therefore download it now.
-
 Brand Analytics Company Profile Gender Diversity At Kantar Ppt Professional Graphics Tutorials Cp Ss V
The following slide highlights the gender diversity present at Kantar company. It shows total employees and gender distribution for employees board of managers, key management personal, and employees Present the topic in a bit more detail with this Brand Analytics Company Profile Gender Diversity At Kantar Ppt Professional Graphics Tutorials Cp Ss V. Use it as a tool for discussion and navigation on Board Of Managers, Key Management Personal, Employees. This template is free to edit as deemed fit for your organization. Therefore download it now.
-
 Brand Analytics Company Profile Gross Profit Ppt Professional Graphics Download Cp Ss V
The following slide highlights the yearly gross profit from 2019 to 2021. it illustrates the changes in profit and margin along with the reasons for the increase and future projection Present the topic in a bit more detail with this Brand Analytics Company Profile Gross Profit Ppt Professional Graphics Download Cp Ss V. Use it as a tool for discussion and navigation on Business, Operations, Optimization. This template is free to edit as deemed fit for your organization. Therefore download it now.
-
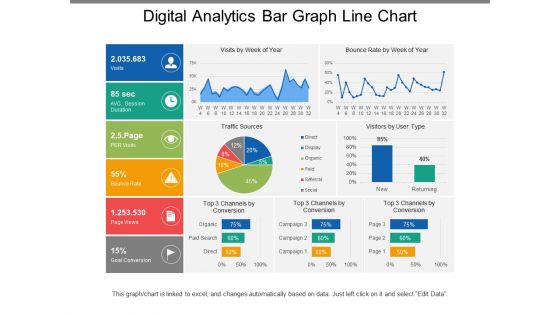 Digital analytics bar graph line chart
Presenting this set of slides with name - Digital Analytics Bar Graph Line Chart. This is a five stage process. The stages in this process are Digital Analytics, Digital Dashboard, Digital Kpis.
-
 Big data analytics retail ppt powerpoint presentation infographic template graphics cpb
Presenting this set of slides with name - Big Data Analytics Retail Ppt Powerpoint Presentation Infographic Template Format Cpb. This is an editable three stages graphic that deals with topics like Big Data Analytics Retail to help convey your message better graphically. This product is a premium product available for immediate download, and is 100 percent editable in Powerpoint. Download this now and use it in your presentations to impress your audience.
-
 Segmentation analytics ppt powerpoint presentation gallery graphics cpb
Presenting this set of slides with name - Segmentation Analytics Ppt Powerpoint Presentation Gallery Graphics Cpb. This is an editable five stages graphic that deals with topics like Segmentation Analytics to help convey your message better graphically. This product is a premium product available for immediate download, and is 100 percent editable in Powerpoint. Download this now and use it in your presentations to impress your audience.
-
 Statistics icon of data analytics using bar graph
Presenting our set of slides with Statistics Icon Of Data Analytics Using Bar Graph. This exhibits information on four stages of the process. This is an easy-to-edit and innovatively designed PowerPoint template. So download immediately and highlight information on Statistics Icon Of Data Analytics Using Bar Graph.
-
 Non analytical method job evaluation ppt powerpoint presentation inspiration graphic images cpb
Presenting our Non Analytical Method Job Evaluation Ppt Powerpoint Presentation Inspiration Graphic Images Cpb PowerPoint template design. This PowerPoint slide showcases three stages. It is useful to share insightful information on Non Analytical Method Job Evaluation. This PPT slide can be easily accessed in standard screen and widescreen aspect ratios. It is also available in various formats like PDF, PNG, and JPG. Not only this, the PowerPoint slideshow is completely editable and you can effortlessly modify the font size, font type, and shapes according to your wish. Our PPT layout is compatible with Google Slides as well, so download and edit it as per your knowledge.
-
 Web analytics tools comparison ppt powerpoint presentation infographic template graphic tips cpb
Presenting Web Analytics Tools Comparison Ppt Powerpoint Presentation Infographic Template Graphic Tips Cpb slide which is completely adaptable. The graphics in this PowerPoint slide showcase four stages that will help you succinctly convey the information. In addition, you can alternate the color, font size, font type, and shapes of this PPT layout according to your content. This PPT presentation can be accessed with Google Slides and is available in both standard screen and widescreen aspect ratios. It is also a useful set to elucidate topics like Web Analytics Tools Comparison. This well-structured design can be downloaded in different formats like PDF, JPG, and PNG. So, without any delay, click on the download button now.
-
 Post Implementation Impact Of Augmented Analytics IT Ppt Graphics
This slide depicts the post implementation impact of augmented analytics, including task automation, conversational analytics, and context aware insight suggestions. Introducing Post Implementation Impact Of Augmented Analytics IT Ppt Graphics to increase your presentation threshold. Encompassed with three stages, this template is a great option to educate and entice your audience. Dispence information on Task Automation, Conversational Analytics, Context Aware Insight Suggestions, using this template. Grab it now to reap its full benefits.
-
 Table Of Contents For Augmented Analytics IT Practices Ppt Graphics
Introducing Table Of Contents For Augmented Analytics IT Practices Ppt Graphics to increase your presentation threshold. Encompassed with one stages, this template is a great option to educate and entice your audience. Dispence information on Table Of Contents For Augmented Analytics IT, using this template. Grab it now to reap its full benefits.
-
 Analytical statistical reports ppt powerpoint presentation slides graphics template cpb
Presenting our Analytical Statistical Reports Ppt Powerpoint Presentation Slides Graphics Template Cpb PowerPoint template design. This PowerPoint slide showcases four stages. It is useful to share insightful information on Analytical Statistical Reports This PPT slide can be easily accessed in standard screen and widescreen aspect ratios. It is also available in various formats like PDF, PNG, and JPG. Not only this, the PowerPoint slideshow is completely editable and you can effortlessly modify the font size, font type, and shapes according to your wish. Our PPT layout is compatible with Google Slides as well, so download and edit it as per your knowledge.
-
 Money data analytics online ppt powerpoint presentation layouts graphics example cpb
Presenting our Money Data Analytics Online Ppt Powerpoint Presentation Layouts Graphics Example Cpb PowerPoint template design. This PowerPoint slide showcases five stages. It is useful to share insightful information on Money Data Analytics Online This PPT slide can be easily accessed in standard screen and widescreen aspect ratios. It is also available in various formats like PDF, PNG, and JPG. Not only this, the PowerPoint slideshow is completely editable and you can effortlessly modify the font size, font type, and shapes according to your wish. Our PPT layout is compatible with Google Slides as well, so download and edit it as per your knowledge.
-
 Big Data Analytics Software Products And Services Company Profile Ppt Show Graphics Download
This slide showcases data engineering, database management, data visualization and multi system data integration tools and software developed with assistance of big data analytics and processing. Increase audience engagement and knowledge by dispensing information using Big Data Analytics Software Products And Services Company Profile Ppt Show Graphics Download. This template helps you present information on four stages. You can also present information on Data Engineering, Database Management, Data Visualization using this PPT design. This layout is completely editable so personaize it now to meet your audiences expectations.
-
 Tasks And Skills Of Data And Analytics Manager Information Science Ppt Graphics
This slide depicts the tasks performed by a data and analytics manager and skills he should have, such as leadership and project management qualities, interpersonal communication skills, and so on. Increase audience engagement and knowledge by dispensing information using Tasks And Skills Of Data And Analytics Manager Information Science Ppt Graphics. This template helps you present information on six stages. You can also present information on Database Systems, Project Management, Interpersonal Communication using this PPT design. This layout is completely editable so personaize it now to meet your audiences expectations.
-
 OLAP And OLTP In Data Warehousing Analytic Application Ppt Graphics
This slide represents the OLAP and OLTP in data warehousing and how OLAP tools are used for multifaceted data analysis and OLTP is designed for transactional applications. Introducing OLAP And OLTP In Data Warehousing Analytic Application Ppt Graphics to increase your presentation threshold. Encompassed with seven stages, this template is a great option to educate and entice your audience. Dispence information on Data Warehousing, Information Analysis, using this template. Grab it now to reap its full benefits.
-
 Steps To Implement Data Warehouse Analytic Application Ppt Graphics
This slide represents the steps to implement a data warehouse in the organization, including enterprise strategies, phased delivery, and iterative prototyping. Increase audience engagement and knowledge by dispensing information using Steps To Implement Data Warehouse Analytic Application Ppt Graphics. This template helps you present information on three stages. You can also present information on Enterprise Strategy, Phased Delivery, Iterative Prototyping using this PPT design. This layout is completely editable so personaize it now to meet your audiences expectations.
-
 What Is Big Data Analytics Ppt Slides Graphics Design
This slide represents the meaning of big data and the complete data handling process such as data collection, storage, research, analysis, visualization, volume, and network. Introducing What Is Big Data Analytics Ppt Slides Graphics Design to increase your presentation threshold. Encompassed with four stages, this template is a great option to educate and entice your audience. Dispence information on Collection, Research, Analysis, using this template. Grab it now to reap its full benefits.
-
 SLA Dashboard With Graph And Analytics Icon
Introducing our SLA Dashboard With Graph And Analytics Icon set of slides. The topics discussed in these slides are SLA Dashboard, Graph And Analytics. This is an immediately available PowerPoint presentation that can be conveniently customized. Download it and convince your audience.
-
 Predictive Analytics Graph Colored Icon In Powerpoint Pptx Png And Editable Eps Format
Give your next presentation a sophisticated, yet modern look with this 100 percent editable Predictive analytics graph colored icon in powerpoint pptx png and editable eps format. Choose from a variety of customizable formats such as PPTx, png, eps. You can use these icons for your presentations, banners, templates, One-pagers that suit your business needs.
-
 Predictive Analytics Graph Monotone Icon In Powerpoint Pptx Png And Editable Eps Format
Make your presentation profoundly eye-catching leveraging our easily customizable Predictive analytics graph monotone icon in powerpoint pptx png and editable eps format. It is designed to draw the attention of your audience. Available in all editable formats, including PPTx, png, and eps, you can tweak it to deliver your message with ease.
-
 Referral analytics dashboard ppt powerpoint presentation summary graphics cpb
Presenting this set of slides with name Referral Analytics Dashboard Ppt Powerpoint Presentation Summary Graphics Cpb. This is an editable Powerpoint three stages graphic that deals with topics like Referral Analytics Dashboard to help convey your message better graphically. This product is a premium product available for immediate download and is 100 percent editable in Powerpoint. Download this now and use it in your presentations to impress your audience.
-
 Advanced marketing analytics ppt powerpoint presentation gallery graphic tips cpb
Presenting this set of slides with name Advanced Marketing Analytics Ppt Powerpoint Presentation Gallery Graphic Tips Cpb. This is an editable Powerpoint one stages graphic that deals with topics like Advanced Marketing Analytics to help convey your message better graphically. This product is a premium product available for immediate download, and is 100 percent editable in Powerpoint. Download this now and use it in your presentations to impress your audience.
-
 Cannibalization analytics ppt powerpoint presentation outline graphics cpb
Presenting this set of slides with name Cannibalization Analytics Ppt Powerpoint Presentation Outline Graphics Cpb. This is a three stage process. The stages in this process are Cannibalization Analytics. This is a completely editable PowerPoint presentation and is available for immediate download. Download now and impress your audience.
-
 Introduction To Predictive Analytics Workflow Ppt Ideas Graphics Pictures
This slide represents the predictive analytics workflow that is widely used in managing energy loads in electric grids. It includes accessing and exploring information, pre-processing data, developing predictive models, and integrating analytics with systems. Introducing Introduction To Predictive Analytics Workflow Ppt Ideas Graphics Pictures to increase your presentation threshold. Encompassed with four stages, this template is a great option to educate and entice your audience. Dispence information on Model Development, Databases, Data Compression, using this template. Grab it now to reap its full benefits.
-
 Predictive Analytics In Identifying Prospects Faster Ppt Infographic Template Graphics Example
This slide depicts how predictive analytics help identifies prospects faster in the marketing industry. It can reduce the sales cycle by better forecasting visitors behavior as they progress through the funnel. Introducing Predictive Analytics In Identifying Prospects Faster Ppt Infographic Template Graphics Example to increase your presentation threshold. Encompassed with six stages, this template is a great option to educate and entice your audience. Dispence information on Management Software CRM, Sales, Marketing Teams, using this template. Grab it now to reap its full benefits.
-
 Predictive Analytics It Predictive Analytics Vs Machine Learning Ppt Portfolio Graphics Template
This slide represents the comparison between predictive analytics and machine learning based on technology used and built on, the functionality of the model, and requirements for the development of the models. Increase audience engagement and knowledge by dispensing information using Predictive Analytics It Predictive Analytics Vs Machine Learning Ppt Portfolio Graphics Template. This template helps you present information on five stages. You can also present information on Recent, Historical Information, Programme Generates Training using this PPT design. This layout is completely editable so personaize it now to meet your audiences expectations.
-
 Training Program For Predictive Analytics Model Ppt Graphics
This slide represents the training program for the predictive analytics model, and it includes the name of teams, trainer names, modules to be covered in training, and the schedule and venue of the training. Introducing Training Program For Predictive Analytics Model Ppt Graphics to increase your presentation threshold. Encompassed with one stages, this template is a great option to educate and entice your audience. Dispence information on Decision Trees, Predictive Analytical Model, using this template. Grab it now to reap its full benefits.
-
 Why Is Predictive Analytics Important Ppt Portfolio Graphics Download
This slide depicts the importance of predictive analytics in different industries. It includes the rise of big data, using cutting-edge technologies for big data and machine learning to extract meaningful insights and increasing competition. Increase audience engagement and knowledge by dispensing information using Why Is Predictive Analytics Important Ppt Portfolio Graphics Download. This template helps you present information on three stages. You can also present information on Big Data, Cutting Edge Technologies using this PPT design. This layout is completely editable so personaize it now to meet your audiences expectations.
-
 Uses Of Predictive Analytics Underwriting Ppt Infographic Template Graphics Download
This slide represents the application of predictive analytics in underwriting by insurance companies. Predictive analytics help them identify future claims by analyzing policyholders historical data patterns and existing risk collection. Introducing Uses Of Predictive Analytics Underwriting Ppt Infographic Template Graphics Download to increase your presentation threshold. Encompassed with five stages, this template is a great option to educate and entice your audience. Dispence information on Data And Predictive Analytics, Policyholders And Claims, using this template. Grab it now to reap its full benefits.
-
 Types Of Big Data Analytics Big Data Analytics Technology IT Ppt Styles Graphics Design
This slide describes the types of big data analytics, covering descriptive analytics, diagnostics, predictive, and prescriptive analytics. It also includes the use cases of these types and their outcomes. Presenting our well structured Types Of Big Data Analytics Big Data Analytics Technology IT Ppt Styles Graphics Design. The topics discussed in this slide are Prescriptive Analytics, Diagnostics Analytics, Predictive Analytics. This is an instantly available PowerPoint presentation that can be edited conveniently. Download it right away and captivate your audience.
-
 Sales Data Bar Graph And Analytics Icon
Presenting our set of slides with Sales Data Bar Graph And Analytics Icon. This exhibits information on three stages of the process. This is an easy to edit and innovatively designed PowerPoint template. So download immediately and highlight information on Sales Data Bar Graph, Analytics Icon.
-
 Data Analytics Graph Colored Icon In Powerpoint Pptx Png And Editable Eps Format
Give your next presentation a sophisticated, yet modern look with this 100 percent editable Data analytics graph colored icon in powerpoint pptx png and editable eps format. Choose from a variety of customizable formats such as PPTx, png, eps. You can use these icons for your presentations, banners, templates, One-pagers that suit your business needs.
-
 Data Analytics Graph Monotone Icon In Powerpoint Pptx Png And Editable Eps Format
Make your presentation profoundly eye-catching leveraging our easily customizable Data analytics graph monotone icon in powerpoint pptx png and editable eps format. It is designed to draw the attention of your audience. Available in all editable formats, including PPTx, png, and eps, you can tweak it to deliver your message with ease.
-
 Action Plan For Implementing BI Budget For SAP Analytics Cloud Training Ppt Diagram Graph Charts
The slide indicates the budget plan for SAP Analytics Cloud training for the organization employees. It also contains information regarding quantity, unit cost and amount allocated for multiple training components that includes instructor fees, course acquisition and printing. Present the topic in a bit more detail with this Action Plan For Implementing BI Budget For SAP Analytics Cloud Training Ppt Diagram Graph Charts. Use it as a tool for discussion and navigation on Courseware Acquisition, Courseware Printing, Analytics Cloud Certification Cost. This template is free to edit as deemed fit for your organization. Therefore download it now.
-
 Brand Analytics Company Profile Awards And Accreditations Ppt Show Graphics Tutorials Cp Ss V
The following slide highlights the recent accolades awarded to Kantar company for their research services provided to the clients. The awards included are iab Europe, esomar, unilever, i-com, amec, and throphees etudes and innovation award Introducing Brand Analytics Company Profile Awards And Accreditations Ppt Show Graphics Tutorials Cp Ss V to increase your presentation threshold. Encompassed with eight stages, this template is a great option to educate and entice your audience. Dispence information on Competition, Consumer, Excellence, using this template. Grab it now to reap its full benefits.
-
 Brand Analytics Company Profile Business Divisions Ppt Show Graphics Template Cp Ss V
The following slide highlights the business divisions of Kantar company to deliver research and consulting services. The divisions are insights, profiles, consulting, media, world panel, numerator and public services Increase audience engagement and knowledge by dispensing information using Brand Analytics Company Profile Business Divisions Ppt Show Graphics Template Cp Ss V. This template helps you present information on seven stages. You can also present information on Assessment, Growth, Opportunities using this PPT design. This layout is completely editable so personaize it now to meet your audiences expectations.
-
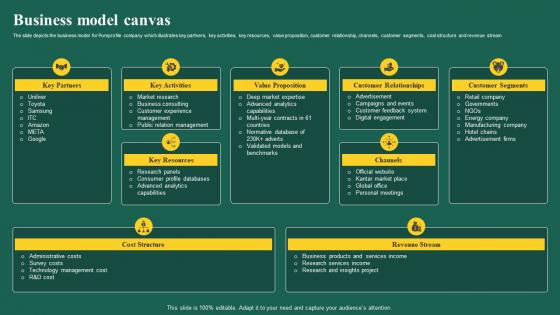 Brand Analytics Company Profile Business Model Canvas Ppt Show Graphics Pictures Cp Ss V
The slide depicts the business model for Pureprofile company which illustrates key partners, key activities, key resources, value proposition, customer relationship, channels, customer segments, cost structure and revenue stream Introducing Brand Analytics Company Profile Business Model Canvas Ppt Show Graphics Pictures Cp Ss V to increase your presentation threshold. Encompassed with nine stages, this template is a great option to educate and entice your audience. Dispence information on Key Activities, Value Proposition, Customer Relationships, using this template. Grab it now to reap its full benefits.
-
 Brand Analytics Company Profile Company Overview Ppt Show Graphics Example Cp Ss V
The slide highlights the company overview illustrating its business details company type, website name, industry, founding year, headquarters, chief executive officer, chief financial officer, products, owner, and total employees. It also shows company outline business divisions, country presence, industries served, and data profiles Present the topic in a bit more detail with this Brand Analytics Company Profile Company Overview Ppt Show Graphics Example Cp Ss V. Use it as a tool for discussion and navigation on Preferences, Expertise Management, Research Services. This template is free to edit as deemed fit for your organization. Therefore download it now.
-
 Brand Analytics Company Profile Consumer Packaged Goods Industry Ppt Show Graphics Download Cp Ss V
The following slide highlights the research services offered by Kantar company to the consumer packaged goods industry. It also shows the clients and impact of solutions provided Deliver an outstanding presentation on the topic using this Brand Analytics Company Profile Consumer Packaged Goods Industry Ppt Show Graphics Download Cp Ss V. Dispense information and present a thorough explanation of Consumption, Anticipate, Analyze using the slides given. This template can be altered and personalized to fit your needs. It is also available for immediate download. So grab it now.


