Powerpoint Templates and Google slides for Analytics Chart
Save Your Time and attract your audience with our fully editable PPT Templates and Slides.
-
 Analysis with magnifying glass bar graph chart highlighting business analytics
Presenting analysis with magnifying glass bar graph chart highlighting business analytics. This is a analysis with magnifying glass bar graph chart highlighting business analytics. This is a three stage process. The stages in this process are analysis, audit, investigation.
-
 Data analytic icon computer pie chart
Presenting data analytic icon computer pie chart. This is a data analytic icon computer pie chart. This is a three stage process. The stages in this process are data analytics icons, information analytics icons, content analytics icons.
-
 Data analytic magnifying glass pie chart bar graph
Presenting data analytic magnifying glass pie chart bar graph. This is a data analytic magnifying glass pie chart bar graph. This is a four stage process. The stages in this process are data analytics icons, information analytics icons, content analytics icons.
-
 Digital analytics social pie chart speedometer magnifying glass
Presenting this set of slides with name - Digital Analytics Social Pie Chart Speedometer Magnifying Glass. This is a five stage process. The stages in this process are Digital Analytics, Digital Dashboard, Digital Kpis.
-
 Digital analytics social pie chart speedometer magnifying glass ppt design
Presenting this set of slides with name - Digital Analytics Social Pie Chart Speedometer Magnifying Glass Ppt Design. This is a five stage process. The stages in this process are Digital Analytics, Digital Dashboard, Digital Kpis.
-
 Market analytics icon with pie chart and bar analytics in center
Presenting this set of slides with name - Market Analytics Icon With Pie Chart And Bar Analytics In Center. This is a four stage process. The stages in this process are Marketing Analytics, Marketing Performance, Marketing Discovery.
-
 Startup organization chart supply chain analytics sales models cpb
Presenting this set of slides with name - Startup Organization Chart Supply Chain Analytics Sales Models Cpb. This is an editable eight stages graphic that deals with topics like Startup Organization Chart, Supply Chain Analytics, Sales Models to help convey your message better graphically. This product is a premium product available for immediate download, and is 100 percent editable in Powerpoint. Download this now and use it in your presentations to impress your audience.
-
 Analytics bar chart circular icon
Presenting this set of slides with name - Analytics Bar Chart Circular Icon. This is a three stage process. The stages in this process are Bar Chart Icon, Bar Graph Icon, Data Chart Icon.
-
 Bar chart and dot graph analytics icon
Presenting this set of slides with name - Bar Chart And Dot Graph Analytics Icon. This is a three stage process. The stages in this process are Bar Chart Icon, Bar Graph Icon, Data Chart Icon.
-
 Analytics framework icon with pie chart
Presenting this set of slides with name - Analytics Framework Icon With Pie Chart. This is a seven stages process. The stages in this process are Analytics Architecture, Analytics Framework, Data Analysis.
-
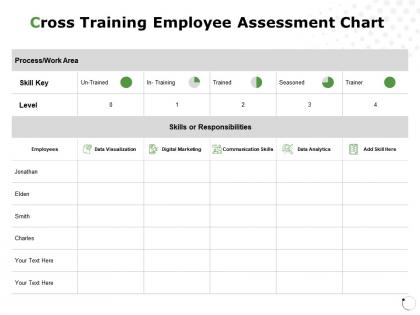 Cross training employee assessment chart data analytics communication ppt powerpoint presentation
Presenting this set of slides with name Cross Training Employee Assessment Chart Data Analytics Communication Ppt Powerpoint Presentation. The topics discussed in these slides are Data Visualization, Skills Or Responsibilities, Data Analytics, Communication Skill, Processe. This is a completely editable PowerPoint presentation and is available for immediate download. Download now and impress your audience.
-
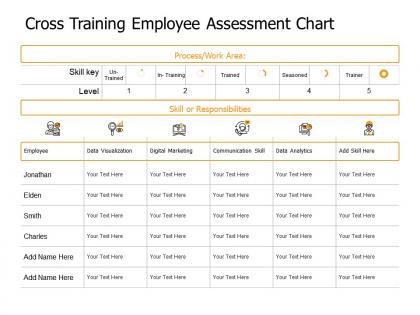 Cross training employee assessment chart data analytics ppt powerpoint presentation
Presenting this set of slides with name Cross Training Employee Assessment Chart Data Analytics Ppt Powerpoint Presentation. The topics discussed in these slides are Employee, Data Visualization, Communication Skill, Business, Table. This is a completely editable PowerPoint presentation and is available for immediate download. Download now and impress your audience.
-
 Analytical curve chart for year based analysis flat powerpoint design
We are proud to present our analytical curve chart for year based analysis flat powerpoint design. This PPT diagram contains the graphic of analytical curve. This PPT diagram can be used for year based analysis for business and marketing results. Use this PPT diagram and build a professional presentation.
-
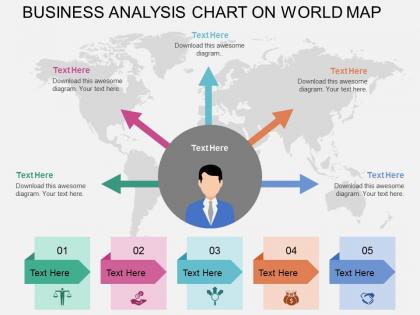 Five staged business analytics chart on world map ppt presentation slides
Presenting five staged business analytics chart on world map ppt presentation slides. This Power Point template slide has been crafted with graphic of five staged analytics chart and world map. This PPT slide contains the concept of business analytics. Use this PPT side for business and marketing related presentations.
-
 Data analytic icon of bar chart report
Presenting this set of slides with name Data Analytic Icon Of Bar Chart Report. The topics discussed in these slide is Data Analytic Icon Of Bar Chart Report. This is a completely editable PowerPoint presentation and is available for immediate download. Download now and impress your audience.
-
 Data analytic icon with bar chart
Presenting this set of slides with name Data Analytic Icon With Bar Chart. The topics discussed in these slide is Data Analytic Icon With Bar Chart. This is a completely editable PowerPoint presentation and is available for immediate download. Download now and impress your audience.
-
 Data analytic icon with gear bar chart
Presenting this set of slides with name Data Analytic Icon With Gear Bar Chart. This is a three stage process. The stages in this process are Data Analytic Icon With Gear Bar Chart. This is a completely editable PowerPoint presentation and is available for immediate download. Download now and impress your audience.
-
 Data analytic icon with pie chart
Presenting this set of slides with name Data Analytic Icon With Pie Chart. This is a three stage process. The stages in this process are Data Analytic Icon With Pie Chart. This is a completely editable PowerPoint presentation and is available for immediate download. Download now and impress your audience.
-
 Data analytic icon with pie chart and smiley
Presenting this set of slides with name Data Analytic Icon With Pie Chart And Smiley. This is a one stage process. The stage in this process is Data Analytic Icon With Pie Chart And Smiley. This is a completely editable PowerPoint presentation and is available for immediate download. Download now and impress your audience.
-
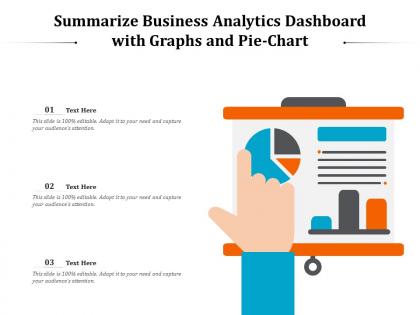 Summarize business analytics dashboard with graphs and pie chart
Presenting this set of slides with name Summarize Business Analytics Dashboard With Graphs And Pie Chart. The topics discussed in these slides is Summarize Business Analytics Dashboard With Graphs And Pie Chart. This is a completely editable PowerPoint presentation and is available for immediate download. Download now and impress your audience.
-
 Charts representing financial data analytics of organization in icon
Introducing our Charts Representing Financial Data Analytics Of Organization In Icon set of slides. The topics discussed in these slides are Charts Representing Financial Data Analytics Of Organization In Icon. This is an immediately available PowerPoint presentation that can be conveniently customized. Download it and convince your audience.
-
 Positive negative chart for analytics capability framework infographic template
This is a single slide titled Positive Negative Chart For Analytics Capability Framework Infographic Template. It is crafted using high quality vector based visuals that are 100 percent editable and available for immediate download in standard and widescreen aspect ratios.
-
 Pie chart template guide to consumer behavior analytics
Deliver an outstanding presentation on the topic using this Pie Chart Template Guide To Consumer Behavior Analytics. Dispense information and present a thorough explanation of Pie Chart Template using the slides given. This template can be altered and personalized to fit your needs. It is also available for immediate download. So grab it now.
-
 Roadmap how to drive revenue with customer journey analytics ppt graph charts
Increase audience engagement and knowledge by dispensing information using Roadmap How To Drive Revenue With Customer Journey Analytics Ppt Graph Charts. This template helps you present information on five stages. You can also present information on Roadmap using this PPT design. This layout is completely editable so personaize it now to meet your audiences expectations.
-
 Ways customer behavior can be studied how to drive revenue with customer journey analytics ppt charts
There are 2 ways to measure customer behavior Customer Personas AND Customer Journey Analytics. Customer Personas are a semi fictional representation of your target customers while customer journey analytics measures customer behavior at each stage of the journey. Introducing Ways Customer Behavior Can Be Studied How To Drive Revenue With Customer Journey Analytics Ppt Charts to increase your presentation threshold. Encompassed with two stages, this template is a great option to educate and entice your audience. Dispence information on Demographics, TRADITIONAL APPROACH, MODERN APPROACH, Measure Customer, using this template. Grab it now to reap its full benefits.
-
 Performance Analytics Metrics Chart Icon
Introducing our premium set of slides with Performance Analytics Metrics Chart Icon. Ellicudate the Three stages and present information using this PPT slide. This is a completely adaptable PowerPoint template design that can be used to interpret topics like Performance Analytics Metrics Chart Icon. So download instantly and tailor it with your information.


