Powerpoint Templates and Google slides for Analytics Chart
Save Your Time and attract your audience with our fully editable PPT Templates and Slides.
-
 Implementing Workforce Analytics HR Analytics Tool 5 Charthop For Employee Data Analytics SS
This slide showcases HR analytics tools used for staff performance management integrations to develop compensation structures. It includes elements such as user friendly, customizable reports, self identification, progress tracking and reporting, compensation and talent records. Deliver an outstanding presentation on the topic using this Implementing Workforce Analytics HR Analytics Tool 5 Charthop For Employee Data Analytics SS. Dispense information and present a thorough explanation of Charthop For Employee Performance, Management Integration, Progress Tracking And Reporting, Compensation And Talent Records using the slides given. This template can be altered and personalized to fit your needs. It is also available for immediate download. So grab it now.
-
 Advanced Analytics Ppt Powerpoint Presentation Diagram Graph Charts
Presenting our set of slides with Advanced Analytics Ppt Powerpoint Presentation Diagram Graph Charts. This exhibits information on one stage of the process. This is an easy to edit and innovatively designed PowerPoint template. So download immediately and highlight information on Advanced Analytics.
-
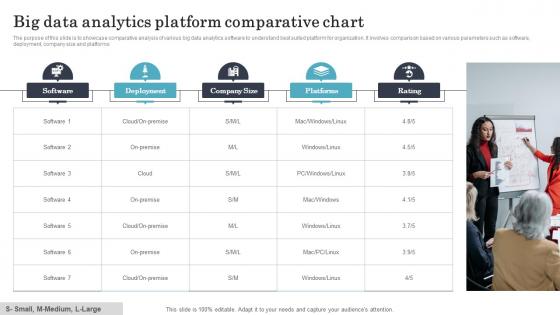 Big Data Analytics Platform Comparative Chart
The purpose of this slide is to showcase comparative analysis of various big data analytics software to understand best suited platform for organization. It involves comparison based on various parameters such as software, deployment, company size and platforms. Introducing our premium set of slides with Big Data Analytics Platform Comparative Chart. Ellicudate the five stages and present information using this PPT slide. This is a completely adaptable PowerPoint template design that can be used to interpret topics like Software, Deployment, Company Size. So download instantly and tailor it with your information.
-
 BI Analytics Process Chart With Responsible Team Heads
This slide represents the process chart for BI analytics with there responsible team heads. This includes steps like identification of business problem, exploring potential data, data analysis and interpretation, etc. Presenting our well structured BI Analytics Process Chart With Responsible Team Heads. The topics discussed in this slide are Identification, Analysis, Inspection. This is an instantly available PowerPoint presentation that can be edited conveniently. Download it right away and captivate your audience.
-
 Visual Bar Chart Data Analytics Icon
Presenting our set of slides with Visual Bar Chart Data Analytics Icon. This exhibits information on three stages of the process. This is an easy to edit and innovatively designed PowerPoint template. So download immediately and highlight information on Analytics Icon, Visual Bar Chart Data.
-
 Icon Showing Data Analytics Chart For Estimating Companies Outcomes
Presenting our well structured Icon Showing Data Analytics Chart For Estimating Companies Outcomes. The topics discussed in this slide are Icon Showing Data, Analytics Chart, Estimating Companies Outcomes. This is an instantly available PowerPoint presentation that can be edited conveniently. Download it right away and captivate your audience.
-
 Data Analytics Candle Chart Icon Showing Industrial Growth
Presenting our set of slides with Data Analytics Candle Chart Icon Showing Industrial Growth This exhibits information on three stages of the process. This is an easy to edit and innovatively designed PowerPoint template. So download immediately and highlight information on Data Analytics Candle Chart, Icon Showing Industrial Growth
-
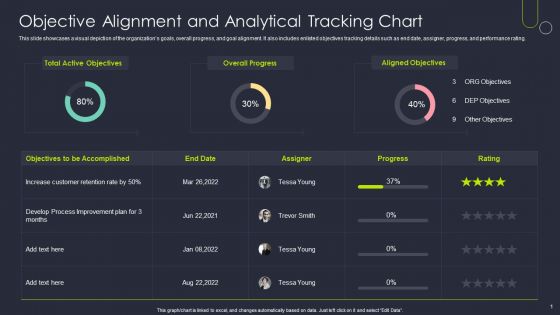 Objective Alignment And Analytical Tracking Chart
This slide showcases a visual depiction of the organizations goals, overall progress, and goal alignment. It also includes enlisted objectives tracking details such as end date, assigner, progress, and performance rating. Presenting our well-structured Objective Alignment And Analytical Tracking Chart. The topics discussed in this slide are Overall Progress, Aligned Objectives, Total Active Objectives. This is an instantly available PowerPoint presentation that can be edited conveniently. Download it right away and captivate your audience.
-
 Stacked Column Chart Marketing Analytics Company Profile CP SS V
Deliver an outstanding presentation on the topic using this Stacked Column Chart Marketing Analytics Company Profile CP SS V Dispense information and present a thorough explanation of Stacked Column Chart using the slides given. This template can be altered and personalized to fit your needs. It is also available for immediate download. So grab it now.
-
 Column Chart Introduction To Marketing Analytics Guide For Data Driven Decision MKT SS
Deliver an outstanding presentation on the topic using this Column Chart Introduction To Marketing Analytics Guide For Data Driven Decision MKT SS. Dispense information and present a thorough explanation of Column Chart using the slides given. This template can be altered and personalized to fit your needs. It is also available for immediate download. So grab it now.
-
 Financial comparison business chart analytics and dashboard
Presenting this set of slides with name - Financial Comparison Business Chart Analytics And Dashboard. This is a one stage process. The stages in this process are Financial Comparison, Financial Analysis, Financial Statement.
-
 Analytic data chart of business kpi image showing employee working on desktop
Presenting this set of slides with name - Analytic Data Chart Of Business Kpi Image Showing Employee Working On Desktop. This is a three stage process. The stages in this process are Business Kpi, Business Dashboard, Business Metrics.
-
 Business kpi contain visualization aid of analytic data in form of bar chart
Presenting this set of slides with name - Business Kpi Contain Visualization Aid Of Analytic Data In Form Of Bar Chart. This is a four stage process. The stages in this process are Business Kpi, Business Dashboard, Business Metrics.
-
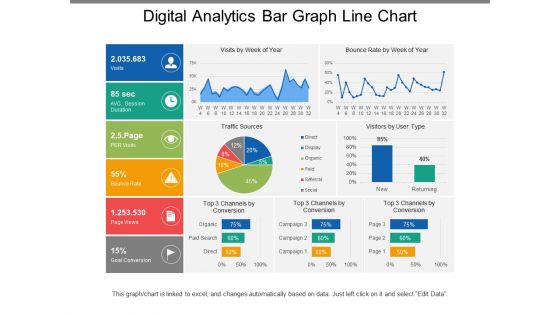 Digital analytics bar graph line chart
Presenting this set of slides with name - Digital Analytics Bar Graph Line Chart. This is a five stage process. The stages in this process are Digital Analytics, Digital Dashboard, Digital Kpis.
-
 Digital analytics dashboard pie chart
Presenting this set of slides with name - Digital Analytics Dashboard Pie Chart. This is a five stage process. The stages in this process are Digital Analytics, Digital Dashboard, Digital Kpis.
-
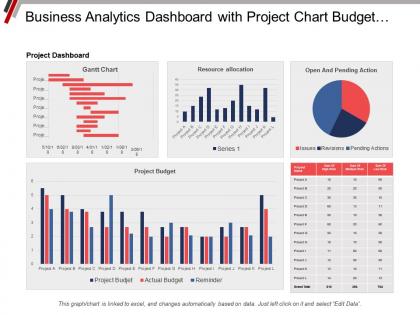 Business analytics dashboard snapshot with project chart budget resource allocation and pending actions
This is a five stage process. The stages in this process are Business Analytics, BA, Organizations Data.
-
 Analytics Change Management Gantt Chart Data Analytics Transformation Toolkit
The slide shows the timeline for assessing and implementing the change in data analytics project. Present the topic in a bit more detail with this Analytics Change Management Gantt Chart Data Analytics Transformation Toolkit. Use it as a tool for discussion and navigation on Analytics, Management, Implementing. This template is free to edit as deemed fit for your organization. Therefore download it now.
-
 Data Analytics Transformation Toolkit Mini Charter Data Analytics Project With Metrics Milestones
This slide shows the formal document that describes the scope of business analytics project covering its goals, key metrics, resources, teams and milestones etc Present the topic in a bit more detail with this Data Analytics Transformation Toolkit Mini Charter Data Analytics Project With Metrics Milestones. Use it as a tool for discussion and navigation on Functional Requirement, Goal Statement, Project Overview. This template is free to edit as deemed fit for your organization. Therefore download it now.
-
 Mini Charter For Data Analytics Project Data Analytics Transformation Toolkit
In this slide, we are highlighting the scope of work for data analytics project. It describes the process, roles and key tasks required to interpret and present the data for a wide range of business applications Deliver an outstanding presentation on the topic using this Mini Charter For Data Analytics Project Data Analytics Transformation Toolkit. Dispense information and present a thorough explanation of Mini Charter For Data Analytics Project using the slides given. This template can be altered and personalized to fit your needs. It is also available for immediate download. So grab it now.
-
 Project Mini Charter For Data Analytics Data Analytics Transformation Toolkit
In this slide, we are providing vital information needed to get the project started. It includes information about project goals, deliverables, business case, participants and key milestones etc. Deliver an outstanding presentation on the topic using this Project Mini Charter For Data Analytics Data Analytics Transformation Toolkit. Dispense information and present a thorough explanation of Project Mini Charter For Data Analytics using the slides given. This template can be altered and personalized to fit your needs. It is also available for immediate download. So grab it now.
-
 Bar Chart Analytics With Person Colored Icon In Powerpoint Pptx Png And Editable Eps Format
Give your next presentation a sophisticated, yet modern look with this 100 percent editable Bar chart analytics with person colored icon in powerpoint pptx png and editable eps format. Choose from a variety of customizable formats such as PPTx, png, eps. You can use these icons for your presentations, banners, templates, One-pagers that suit your business needs.
-
 Bar Chart Analytics With Person Monotone Icon In Powerpoint Pptx Png And Editable Eps Format
Make your presentation profoundly eye-catching leveraging our easily customizable Bar chart analytics with person monotone icon in powerpoint pptx png and editable eps format. It is designed to draw the attention of your audience. Available in all editable formats, including PPTx, png, and eps, you can tweak it to deliver your message with ease.
-
 Online Analytics Chart And Magnifier Colored Icon In Powerpoint Pptx Png And Editable Eps Format
Give your next presentation a sophisticated, yet modern look with this 100 percent editable Online analytics chart and magnifier colored icon in powerpoint pptx png and editable eps format. Choose from a variety of customizable formats such as PPTx, png, eps. You can use these icons for your presentations, banners, templates, One-pagers that suit your business needs.
-
 Online Analytics Chart And Magnifier Monotone Icon In Powerpoint Pptx Png And Editable Eps Format
Make your presentation profoundly eye-catching leveraging our easily customizable Online analytics chart and magnifier monotone icon in powerpoint pptx png and editable eps format. It is designed to draw the attention of your audience. Available in all editable formats, including PPTx, png, and eps, you can tweak it to deliver your message with ease.
-
 Data Analytics Change Management Gantt Chart Business Analytics Transformation Toolkit
Your complex projects can be managed and organized simultaneously using this detailed Data Analytics Change Management Gantt Chart Business Analytics Transformation Toolkit template. Track the milestones, tasks, phases, activities, and subtasks to get an updated visual of your project. Share your planning horizon and release plan with this well crafted presentation template. This exemplary template can be used to plot various dependencies to distinguish the tasks in the pipeline and their impact on the schedules and deadlines of the project. Apart from this, you can also share this visual presentation with your team members and stakeholders. It a resourceful tool that can be incorporated into your business structure. Therefore, download and edit it conveniently to add the data and statistics as per your requirement.
-
 Mini Charter For Data Analytics Project Business Analytics Transformation Toolkit
In this slide, we are highlighting the scope of work for data analytics project. It describes the process, roles and key tasks required to interpret and present the data for a wide range of business applications Introducing Mini Charter For Data Analytics Project Business Analytics Transformation Toolkit to increase your presentation threshold. Encompassed with six stages, this template is a great option to educate and entice your audience. Dispense information on Data Preparation, Operationalize Analytics, Analytic Opportunity Discovery, using this template. Grab it now to reap its full benefits.
-
 Project Mini Charter For Data Analytics Business Analytics Transformation Toolkit
In this slide, we are providing vital information needed to get the project started. It includes information about project goals, deliverables, business case, participants and key milestones etc. Deliver an outstanding presentation on the topic using this Project Mini Charter For Data Analytics Business Analytics Transformation Toolkit. Dispense information and present a thorough explanation of Identify Data Sources, Identify Business Problem, Organize Data, Data Cleaning using the slides given. This template can be altered and personalized to fit your needs. It is also available for immediate download. So grab it now.
-
 Data Analytics Change Management Gantt Chart Process Of Transforming Data Toolkit
The slide shows the timeline for assessing and implementing the change in data analytics project. Increase audience engagement and knowledge by dispensing information using Data Analytics Change Management Gantt Chart Process Of Transforming Data Toolkit. This template helps you present information on one stage. You can also present information on Change Execution, Assessments Solutioning, Data Analytics using this PPT design. This layout is completely editable so personaize it now to meet your audiences expectations.
-
 Mini Charter For Data Analytics Process Of Transforming Data Toolkit
This slide shows the formal document that describes the scope of business analytics project covering its goals, key metrics, resources, teams and milestones etc. Present the topic in a bit more detail with this Mini Charter For Data Analytics Process Of Transforming Data Toolkit. Use it as a tool for discussion and navigation on Business Intelligence, Data Project, Project Overview. This template is free to edit as deemed fit for your organization. Therefore download it now.
-
 Mini Charter For Data Analytics Project Process Of Transforming Data Toolkit
In this slide, we are highlighting the scope of work for data analytics project. It describes the process, roles and key tasks required to interpret and present the data for a wide range of business applications. Deliver an outstanding presentation on the topic using this Mini Charter For Data Analytics Project Process Of Transforming Data Toolkit. Dispense information and present a thorough explanation of Analytic Opportunity Discovery, Data Preparation, Operationalize Analytics using the slides given. This template can be altered and personalized to fit your needs. It is also available for immediate download. So grab it now.
-
 Project Mini Charter For Data Analytics Process Of Transforming Data Toolkit
In this slide, we are providing vital information needed to get the project started. It includes information about project goals, deliverables, business case, participants and key milestones etc. Introducing Project Mini Charter For Data Analytics Process Of Transforming Data Toolkit to increase your presentation threshold. Encompassed with three stages, this template is a great option to educate and entice your audience. Dispence information on Business Case, Team Members, Risks And Constraints, using this template. Grab it now to reap its full benefits.
-
 Data Analytics Change Management Gantt Chart Transformation Toolkit Data Analytics Business Intelligence
The slide shows the timeline for assessing and implementing the change in data analytics project.Present the topic in a bit more detail with this Data Analytics Change Management Gantt Chart Transformation Toolkit Data Analytics Business Intelligence. Use it as a tool for discussion and navigation on Stakeholder Assessment, Design Documentation, Measure Change. This template is free to edit as deemed fit for your organization. Therefore download it now.
-
 Mini Charter For Data Analytics Project Transformation Toolkit Data Analytics Business
This slide shows the formal document that describes the scope of business analytics project covering its goals, key metrics, resources, teams and milestones etc.Present the topic in a bit more detail with this Mini Charter For Data Analytics Project Transformation Toolkit Data Analytics Business. Use it as a tool for discussion and navigation on Business Intelligence, Project Information, Project Approach. This template is free to edit as deemed fit for your organization. Therefore download it now.
-
 Project Mini Charter For Data Analytics Transformation Toolkit Data Analytics Business Intelligence
In this slide, we are providing vital information needed to get the project started. It includes information about project goals, deliverables, business case, participants and key milestones etc.Present the topic in a bit more detail with this Project Mini Charter For Data Analytics Transformation Toolkit Data Analytics Business Intelligence. Use it as a tool for discussion and navigation on Machine Learning, Identify Business, Interpret Evaluate. This template is free to edit as deemed fit for your organization. Therefore download it now.
-
 Transformation Toolkit Data Analytics Business Intelligence Mini Charter For Data Analytics Project
In this slide, we are highlighting the scope of work for data analytics project. It describes the process, roles and key tasks required to interpret and present the data for a wide range of business applications.Deliver an outstanding presentation on the topic using this Transformation Toolkit Data Analytics Business Intelligence Mini Charter For Data Analytics Project. Dispense information and present a thorough explanation of Opportunity Discovery, Data Preparation, Predict Model using the slides given. This template can be altered and personalized to fit your needs. It is also available for immediate download. So grab it now.
-
 Predictive Analytics Chart Colored Icon In Powerpoint Pptx Png And Editable Eps Format
Give your next presentation a sophisticated, yet modern look with this 100 percent editable Predictive analytics chart colored icon in powerpoint pptx png and editable eps format. Choose from a variety of customizable formats such as PPTx, png, eps. You can use these icons for your presentations, banners, templates, One-pagers that suit your business needs.
-
 Predictive Analytics Chart Monotone Icon In Powerpoint Pptx Png And Editable Eps Format
Make your presentation profoundly eye-catching leveraging our easily customizable Predictive analytics chart monotone icon in powerpoint pptx png and editable eps format. It is designed to draw the attention of your audience. Available in all editable formats, including PPTx, png, and eps, you can tweak it to deliver your message with ease.
-
 Data Analytics Change Management Gantt Chart Data Anaysis And Processing Toolkit
The slide shows the timeline for assessing and implementing the change in data analytics project. Deliver an outstanding presentation on the topic using this Data Analytics Change Management Gantt Chart Data Anaysis And Processing Toolkit. Dispense information and present a thorough explanation of Change Execution, Assessments And Solutioning using the slides given. This template can be altered and personalized to fit your needs. It is also available for immediate download. So grab it now.
-
 Mini Charter For Data Analytics Project Data Anaysis And Processing Toolkit
In this slide, we are highlighting the scope of work for data analytics project. It describes the process, roles and key tasks required to interpret and present the data for a wide range of business applications. Present the topic in a bit more detail with this Mini Charter For Data Analytics Project Data Anaysis And Processing Toolkit. Use it as a tool for discussion and navigation on Analytic Opportunity Discovery, Data Preparation, Operationalize Analytics. This template is free to edit as deemed fit for your organization. Therefore download it now.
-
 Mini Charter For Data Analytics Project With Metrics Data Anaysis And Processing Toolkit
This slide shows the formal document that describes the scope of business analytics project covering its goals, key metrics, resources, teams and milestones etc. Deliver an outstanding presentation on the topic using this Mini Charter For Data Analytics Project With Metrics Data Anaysis And Processing Toolkit. Dispense information and present a thorough explanation of Project Charter, Milestones, Functional Requirement using the slides given. This template can be altered and personalized to fit your needs. It is also available for immediate download. So grab it now.
-
 Project Mini Charter For Data Analytics Data Anaysis And Processing Toolkit
In this slide, we are providing vital information needed to get the project started. It includes information about project goals, deliverables, business case, participants and key milestones etc. Introducing Project Mini Charter For Data Analytics Data Anaysis And Processing Toolkit to increase your presentation threshold. Encompassed with one stage, this template is a great option to educate and entice your audience. Dispence information on Team Members, Risks And Constraints, Milestones, using this template. Grab it now to reap its full benefits.
-
 Data Analytics Change Management Gantt Chart Data Science And Analytics Transformation Toolkit
The slide shows the timeline for assessing and implementing the change in data analytics project. Present the topic in a bit more detail with this Data Analytics Change Management Gantt Chart Data Science And Analytics Transformation Toolkit. Use it as a tool for discussion and navigation on Management, Implementing, Timeline. This template is free to edit as deemed fit for your organization. Therefore download it now.
-
 Data Science And Analytics Transformation Toolkit Mini Charter For Data Analytics Project
In this slide, we are highlighting the scope of work for data analytics project. It describes the process, roles and key tasks required to interpret and present the data for a wide range of business applications. Increase audience engagement and knowledge by dispensing information using Data Science And Analytics Transformation Toolkit Mini Charter For Data Analytics Project. This template helps you present information on six stages. You can also present information on Analytics, Validation, Operationalize using this PPT design. This layout is completely editable so personaize it now to meet your audiences expectations.
-
 Mini Charter For Data Analytics Project With Metrics And Milestones Data Science Transformation Toolkit
This slide shows the formal document that describes the scope of business analytics project covering its goals, key metrics, resources, teams and milestones etc. Present the topic in a bit more detail with this Mini Charter For Data Analytics Project With Metrics And Milestones Data Science Transformation Toolkit. Use it as a tool for discussion and navigation on Project Information, Analytics, Milestones. This template is free to edit as deemed fit for your organization. Therefore download it now.
-
 Project Mini Charter For Data Analytics Data Science And Analytics Transformation Toolkit
In this slide, we are providing vital information needed to get the project started. It includes information about project goals, deliverables, business case, participants and key milestones etc. Deliver an outstanding presentation on the topic using this Project Mini Charter For Data Analytics Data Science And Analytics Transformation Toolkit. Dispense information and present a thorough explanation of Analytics, Information, Business using the slides given. This template can be altered and personalized to fit your needs. It is also available for immediate download. So grab it now.
-
 Website Analytics Chart Colored Icon In Powerpoint Pptx Png And Editable Eps Format
This colourful PowerPoint icon is perfect for any website chart. It is easy to use and adds a vibrant touch to any presentation. It is available in a range of colours and sizes to suit any project. It is the ideal way to make your charts stand out and be noticed.
-
 Website Analytics Chart Monotone Icon In Powerpoint Pptx Png And Editable Eps Format
This Monotone powerpoint icon is perfect for any website chart. It is simple and elegant, and will add a professional touch to any presentation. It is easy to download and use, and will make your charts look modern and professional.
-
 Data Analytics Through Pie Chart Colored Icon In Powerpoint Pptx Png And Editable Eps Format
Give your next presentation a sophisticated, yet modern look with this 100 percent editable Data analytics through pie chart colored icon in powerpoint pptx png and editable eps format. Choose from a variety of customizable formats such as PPTx, png, eps. You can use these icons for your presentations, banners, templates, One-pagers that suit your business needs.
-
 Data Analytics Through Pie Chart Monotone Icon In Powerpoint Pptx Png And Editable Eps Format
Make your presentation profoundly eye-catching leveraging our easily customizable Data analytics through pie chart monotone icon in powerpoint pptx png and editable eps format. It is designed to draw the attention of your audience. Available in all editable formats, including PPTx, png, and eps, you can tweak it to deliver your message with ease.
-
 Action Plan For Implementing BI Budget For SAP Analytics Cloud Training Ppt Diagram Graph Charts
The slide indicates the budget plan for SAP Analytics Cloud training for the organization employees. It also contains information regarding quantity, unit cost and amount allocated for multiple training components that includes instructor fees, course acquisition and printing. Present the topic in a bit more detail with this Action Plan For Implementing BI Budget For SAP Analytics Cloud Training Ppt Diagram Graph Charts. Use it as a tool for discussion and navigation on Courseware Acquisition, Courseware Printing, Analytics Cloud Certification Cost. This template is free to edit as deemed fit for your organization. Therefore download it now.
-
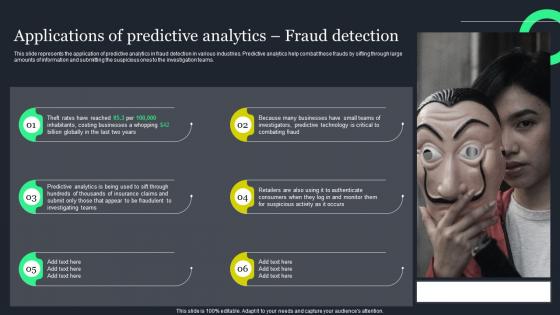 Applications Of Predictive Analytics Fraud Ppt Powerpoint Presentation Diagram Graph Charts
This slide represents the application of predictive analytics in fraud detection in various industries. Predictive analytics help combat these frauds by sifting through large amounts of information and submitting the suspicious ones to the investigation teams. Increase audience engagement and knowledge by dispensing information using Applications Of Predictive Analytics Fraud Ppt Powerpoint Presentation Diagram Graph Charts. This template helps you present information on six stages. You can also present information on Businesses, Investigators, Technology using this PPT design. This layout is completely editable so personaize it now to meet your audiences expectations.
-
 Data Analytics Project Management Gantt Chart On Daily Basis
This slide depicts the project management streamline of data analytics on daily basis by setting different target days Presenting our well structured Data Analytics Project Management Gantt Chart On Daily Basis The topics discussed in this slide are Data Analytics Project, Management Gantt ChartThis is an instantly available PowerPoint presentation that can be edited conveniently. Download it right away and captivate your audience.
-
 Marketing analytics software comparison pie chart powerpoint images
Presenting marketing analytics software comparison pie chart powerpoint images. This is a marketing analytics software comparison pie chart powerpoint images. This is a three stage process. The stages in this process are marketing, analysis, measure, pie chart, comparison.
-
 Business analytics evolution chart example of ppt
Presenting Business Analytics Evolution Chart Example Of PPT template. This presentation diagram is 100% editable in PowerPoint software. This will allow you to alter the font type, size, and colors of the slide, etc. according to the situation. The slide is compatible with Google Slides and can be saved in popular image formats such as JPG or PDF. High-quality graphics and icons ensure that there is no distortion in the quality even when it is viewed in fullscreen.
-
 Data analytics process icon showing magnifying glass with pie chart
Presenting this set of slides with name - Data Analytics Process Icon Showing Magnifying Glass With Pie Chart. This is a two stage process. The stages in this process are Data Analytics Process, Data Analysis Cycle, Data Visualization Process.
-
 Mobile analytics icon having pie chart
Presenting this set of slides with name - Mobile Analytics Icon Having Pie Chart. This is a one stage process. The stages in this process are Mobile Analytics, Mobile Tracking, Mobile Web Analytics.
-
 Mobile analytics icon showing pie chart bar graph data analytics
Presenting this set of slides with name - Mobile Analytics Icon Showing Pie Chart Bar Graph Data Analytics. This is a one stage process. The stages in this process are Mobile Analytics, Mobile Tracking, Mobile Web Analytics.
-
 Mobile analytics showing magnifying glass and pie chart
Presenting this set of slides with name - Mobile Analytics Showing Magnifying Glass And Pie Chart. This is a four stage process. The stages in this process are Mobile Analytics, Mobile Tracking, Mobile Web Analytics.
-
 Team chart in bulb and circles with analytics and bulb image
Presenting this set of slides with name - Team Chart In Bulb And Circles With Analytics And Bulb Image. This is a six stage process. The stages in this process are Team Chart, Group Chart, Member Chart.
-
 Analysis with bar graph pie chart key factors highlighting business analytics
Presenting analysis with bar graph pie chart key factors highlighting business analytics. This is a analysis with bar graph pie chart key factors highlighting business analytics. This is a two stage process. The stages in this process are analysis, audit, investigation.


