- Sub Categories
-
- Accounting
- Agriculture
- Auditing
- Beauty and Fashion
- Branding
- Business
- Communication
- Construction
- Contact Management
- Corporate Social Responsibility
- Creative
- Customer Support
- Cybersecurity
- Data Management
- Decision Making
- Design
- Disproportionate Illustrations
- Documentation
- E-commerce
- Education and Professional Development
- Engineering
- Environment
- Facility Management
- Finance
- Flat Illustrations
- Food and Beverage
- Furniture
- Gaming
- Hospitality
- HR
- Illustration
- Information Technology
- Innovation
- Insurance
- Isometric Illustrations
- IT Operations
- Laboratory
- Legal
- Location
- Management
- Manufacturing
- Market Research
- Marketing and Advertising
- Measurement
- Media
- Medical and Healthcare
- Office Supplies
- Operations
- Organizational Culture
- Performance Management
- Policy
- Product Management
- Productivity
- Project Management
- Quality Control
- Recruitment
- Remote Work
- Retail
- Risk Management
- Safety
- Sales
- Salon and Barbershop Business
- Science
- Service
- Social Media
- Social Responsibility
- Sustainability
- Technology
- Tools and Equipment
- Training
- Waste Management
- Web Design
-
 Company Performance Gap Analysis Illustration
This colourful PowerPoint Illustration is an eye-catching visual representation of company performance. Its perfect for presentations and reports, and can be used to illustrate key performance indicators.
-
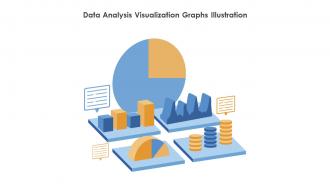 Data Analysis Visualization Graphs Illustration
Brightly powerpoint Illustration with a bar graph to represent data visualization. Perfect for presentations, reports, and other documents to illustrate data points and trends.
-
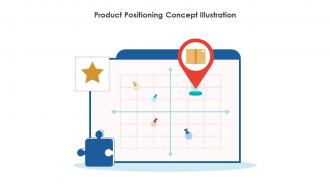 Product Positioning Concept Illustration
This PowerPoint Illustration is perfect for illustrating product positioning in a presentation. Its vibrant colours and clear design make it easy to understand and visually appealing, making it an ideal choice for any presentation.
-
 Social Media Content Creation Illustration
This colourful powerpoint Illustration is perfect for creating eye-catching social media content. It features a vibrant colour palette and stylish design to help you create a professional and engaging post. Its the perfect way to add a creative touch to your content.
-
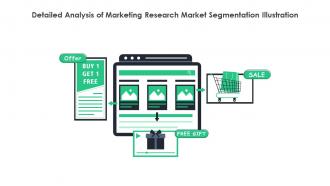 Detailed Analysis Of Marketing Research Market Segmentation Illustration
This coloured powerpoint Illustration is perfect for illustrating detailed analysis of marketing. It features a colourful graph, bar chart and pie chart, making it easy to understand complex marketing data. Its a great way to visually present your marketing analysis and make an impact.
-
 Food Company Financial Report Revenue Profit Illustration
This PowerPoint Illustration depicts a colorful pie chart with a dollar sign in the center, representing a financial report from a food company. It is perfect for presentations on financial management, budgeting, and investments.
-
 Market Analysis Research And Trends Illustration
This colourful PowerPoint Illustration is perfect for representing market analysis. It features a chart with an upward arrow and a dollar sign, illustrating growth and success. Use it to add a visual element to your presentations and documents.
-
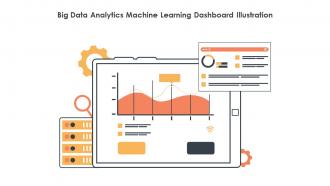 Big Data Analytics Machine Learning Dashboard Illustration
This coloured powerpoint Illustration provides an overview of cost reduction techniques to increase profitability. It is a useful tool for businesses to identify areas of potential cost savings and to develop strategies to improve their bottom line.
-
 Comprehensive Guide To Consulting Corporate Strategy Illustration
This powerpoint Illustration is a comprehensive guide to KPMG strategy, featuring a colourful and eye-catching design. It provides a comprehensive overview of KPMGs strategic objectives, and can be used to help presenters effectively communicate their message. Its the perfect visual aid for any KPMG presentation.
-
 Cost Reduction Techniques To Increase Profitability Illustration
This coloured PowerPoint Illustration is an ideal visual aid for creating a trade marketing plan to increase market share. It features a vibrant colour palette and a simple design that conveys the key points of your strategy in an easy-to-understand way. Use it to make your presentations stand out and help your audience understand your plan.
-
 Detailed Analysis Of Marketing Strategy Illustration
This coloured PowerPoint Illustration is perfect for illustrating detailed analysis of marketing strategy. It features a graph with multiple bars of different colours to represent data and a magnifying glass to represent close examination of the data. It is a great visual tool to help explain complex marketing concepts.
-
 Effective Strategy Formulation Business Goals Illustration
This coloured PowerPoint Illustration is an effective strategy formulation tool. It helps to identify and analyse the key components of a successful strategy. It provides a comprehensive overview of the process and helps to identify the best strategies for achieving desired goals.
-
 Trade Marketing Plan To Increase Market Share Illustration
This coloured powerpoint Illustration is perfect for illustrating a trade marketing plan to increase market share. It features a vibrant, eye-catching design with a professional look and feel. Its an ideal way to visualize your plan and make it stand out from the competition.
-
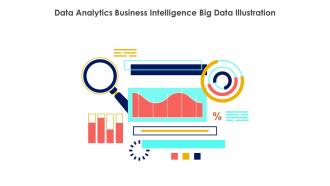 Data Analytics Business Intelligence Big Data Illustration
This coloured powerpoint Illustration is perfect for presentations on data analytics. It features a vibrant blue and green colour scheme, with a graph and chart image to represent data analysis. It is a great visual aid to help communicate complex data in an easy to understand format.
-
 Financial Investment Budgeting Plan Illustration
This coloured PowerPoint Illustration is perfect for presentations related to financial topics. It features a stack of coins with a bright, vibrant colour palette that will make your slides stand out. Its a great way to add a professional touch to your financial presentations.
-
 Things To Consider Before Investing In Real Estate Market Illustration
This coloured powerpoint Illustration provides a visual representation of the key points to consider before investing in the real estate market, such as location, market trends, and financial resources. It is a helpful tool for investors to ensure they make informed decisions.
-
 Magnifier Glass Analysis Illustration
This colourful PowerPoint Illustration is a perfect visual representation of the concept of analysis. It features a magnifying glass with a colourful background, making it a great addition to any presentation. Use it to emphasize the importance of research and data-driven decisions.
-
 Company Financial Plan Budgeting Forecasting Illustration
This coloured powerpoint Illustration is the perfect visual aid to demonstrate a companys financial plan. It features a graph, chart and other visuals to help explain the financial plan in an easy to understand manner. It can be used in presentations, reports, and other documents to help illustrate the companys financial plan.
-
 Customer Research Market Analysis Consumer Behavior Illustration
This coloured powerpoint Illustration is perfect for presentations on customer research. It features a magnifying glass and a chart, representing the process of gathering customer feedback. Its a great visual aid to help explain the importance of customer research.
-
 Product Discovery Online Shopping Illustration
This coloured PowerPoint icon is perfect for Product Discovery presentations. It is a modern, vibrant design that will make your slides stand out. It is easy to use and can be customized to fit any presentation. It is sure to make your product discovery presentation look professional and engaging.
-
 Gold Coin Money Leakage Illustration
This colourful PowerPoint Illustration is perfect for presentations on money related topics. It features a stack of coins in bright hues of green, yellow, and blue. Use it to add a modern and professional touch to your slides.
-
 Stock Prediction Investment Forecasting Illustration
This coloured powerpoint Illustration is perfect for presentations on stock predictions. It features a graph and a chart with an upward arrow, representing a positive trend. The Illustration is designed to be eye-catching and informative, making it ideal for any financial presentation.
-
 Marketing Research Consumer Insights Market Analysis Illustration
This coloured PowerPoint Illustration is perfect for presentations on marketing research. It features a magnifying glass and a graph, representing the process of gathering and analyzing data to make informed business decisions.
-
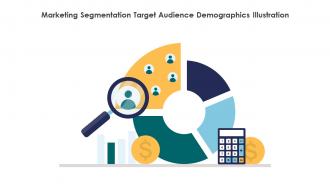 Marketing Segmentation Target Audience Demographics Illustration
This colourful PowerPoint Illustration is perfect for illustrating Out of Home Advertising concepts. It features a vibrant design with a variety of colours and shapes to help you communicate your message clearly and effectively. Use this Illustration to make your presentation stand out.
-
 Share Market Investment Analysis Strategies Illustration
This coloured PowerPoint Illustration is perfect for creating professional presentations on Share Market Analysis. It features a vibrant design with a graph and a chart to illustrate the performance of the market. Its an ideal choice for business professionals and investors.
-
 Social Media Monitoring Web Traffic Analysis Illustration
This colourful PowerPoint Illustration is perfect for presentations on social media traffic analytics. It features a graph chart with multiple bars and a magnifying glass, representing the analysis of data. Ideal for business and marketing presentations.
-
 Always Stay Hungry For Acquiring Knowledge Illustration
This coloured PowerPoint Illustration depicts a hungry person with a book in their hand, symbolizing the need to always stay hungry for acquiring knowledge. It is a great addition to any presentation, conveying a powerful message in a fun and creative way.
-
 Business Diversification Strategies Illustration
This coloured powerpoint Illustration is perfect for presentations on business diversification strategies. It features a pie chart with multiple sections, each in a different colour, to represent the various strategies available. Use it to visually explain the concept of diversification to your audience.
-
 Data Analytical Research Analysis Statistical Illustration
This colourful PowerPoint Illustration is perfect for illustrating data analytical research. It features a magnifying glass and a graph, representing the process of collecting and analyzing data. Its ideal for presentations, reports, and other documents.
-
 Graph Analysis Network Analysis Data Visualization Illustration
This coloured powerpoint Illustration is perfect for visualizing the results of your graph analysis. It features a graph with a colourful background, making it easy to interpret and understand. Perfect for presentations, reports and other documents.
-
 Auction Property Real Estate Bidding Illustration
This vibrant coloured PowerPoint Illustration is perfect for representing auction property in presentations. It has a modern design and is sure to make your slides stand out.
-
 Income Growth Economic Expansion Financial Increase Illustration
This colourful PowerPoint Illustration shows a graph of income growth over time. It is a great visual representation to illustrate the success of a business or the growth of an economy. It is perfect for presentations and reports.
-
 Real Estate Flipper Property Investment Home Renovation Illustration
This vibrant PowerPoint Illustration is perfect for real estate flippers. It features a house with a For Sale sign, and the colors of blue and yellow make it stand out. It is an effective way to represent the real estate flipping industry.
-
 Real Estate Investment Property Illustration
This vibrant PowerPoint Illustration is perfect for presentations on real estate investment. It features a colourful house Illustration with a dollar sign to represent the financial aspect of the topic. Use this Illustration to make your presentation stand out and capture the attention of your audience.
-
 Research Project Data Analysis Research Methodology Illustration
This coloured PowerPoint Illustration is perfect for representing a research project. It features a magnifying glass over a stack of books, symbolizing exploration and knowledge. The vibrant colours will make your slides stand out and draw attention to your research.
-
 Analyze Data Data Analysis Data Mining Illustration
This colourful PowerPoint icon depicts a person analyzing data. It is perfect for presentations about data analysis, data science, and data visualization. It can be used to illustrate the importance of data analysis and its impact on decision-making.
-
 Data Research Analysis Collection Illustration
This coloured PowerPoint icon is perfect for presentations on data research. It features a magnifying glass and a graph, symbolizing the process of data collection and analysis. The vibrant colours make it stand out and help to convey the message quickly and effectively.
-
 Brand Marketing Advertising Social Media Illustration
This colourful PowerPoint icon is an ideal visual aid to illustrate your brand marketing strategy. It features a vibrant design with a range of colours to help you communicate your message effectively. Perfect for presentations, slideshows and more.
-
 Market Competition And Share Pricing Strategies Illustration
This colourful PowerPoint icon is perfect for illustrating market competition in presentations. It features a vibrant, eye catching design that will make your slides stand out. The icon is easy to customize and can be used to emphasize key points about market competition.
-
 Data Analytics Big Data Business Intelligence Illustration
This colourful PowerPoint icon on Data Analytics is perfect for presentations, reports, and other documents. It features a vibrant blue, green and yellow colour palette and a high-quality design that will bring life to any project. Its the perfect way to illustrate data-driven insights and analytics in a visually appealing way.
-
 Market Analysis And Survey For Electric Cars Illustration
This coloured PowerPoint icon is perfect for presentations on market analysis and survey for electric cars. It features a modern design with a car silhouette and a chart of data points. Use it to illustrate your research and analysis of the electric car market.
-
 Analyzing Dashboard Data Visualization Metrics Illustration
This colored PowerPoint icon is perfect for visualizing data and analyzing dashboard. It features a graph, charts, and other elements to help you track and analyze data quickly and easily. Perfect for presentations and reports.
-
 Business Analyzing Growth Graph Illustration
This vibrant coloured icon depicts a business analyzing growth graph to show the progress of a company. It is perfect for use in presentations, reports, and documents to illustrate the success of a business.
-
 Frequently Asked Questions For Website Illustration
This vibrant coloured powerpoint icon is a perfect visual aid for your presentation on New Product Release Strategy for the Finance Industry. It is an effective way to communicate your ideas and strategies to your audience.
-
 Hand Holding Money Coin Illustration
This coloured PowerPoint icon features a hand holding a coin. It is a perfect visual representation of wealth, success, and financial stability. It can be used to illustrate concepts such as investment, savings, and financial planning. It is a great addition to any presentation or report.
-
 Global Market Share Of Iot Thermostats Illustrations
This coloured PowerPoint icon depicts the global market share of IoT thermostats in 2020. It illustrates the leading players in the market and the percentage of their market share. This icon is an invaluable resource for understanding the current and potential future of the IoT thermostat market.
-
 Information Management Illustration
This colourful PowerPoint Illustration features a magnifying glass and a chart, representing data research. The vibrant colours and clean design make it perfect for presentations and reports related to data analysis and research. Use it to add a professional touch to your slides and make your data stand out.
-
 Planning Marketing Strategy Illustration
This brightly coloured PowerPoint illustration represents the dynamic world of business research and development. With its vibrant hues and modern design, it is the perfect addition to any presentation on innovative strategies and cutting edge ideas in the business world. Use it to showcase your companys commitment to growth and progress.
-
 Customer Attraction Campaign Illustration
Boost your businesss return on investment with our ROI through Targeted Marketing PowerPoint icon. Featuring a vibrant colour scheme and eye-catching design, this icon is perfect for presentations and reports on effective marketing strategies that drive measurable results. Enhance your audiences understanding of ROI and stand out from the competition with this dynamic icon.
-
 Market Performance Illustration
This vibrant powerpoint icon features a bold and eye-catching design, perfect for presentations related to the stock market. With its striking color and clean lines, this icon will add a professional touch to any financial presentation or report. Download now and enhance your stock market presentations with this dynamic icon.
-
 Woman Hold Magnifying Glass Illustration
This coloured PowerPoint icon is perfect for all your research needs. With its vibrant and eye-catching design, it will add a professional touch to your presentations. It is easy to use and can be customized to fit your specific research topic. Download now and make your presentations stand out.
-
 Global Stock Market Illustration
This brightly coloured PowerPoint icon features a bold design that represents the fast-paced and dynamic world of the stock market. Perfect for presentations and reports related to finance, investments, and economics, this icon will add a professional touch to your slides and help your audience visualize complex concepts with ease.
-
 Market Volatility Illustration
This brightly coloured PowerPoint icon features a bold design that represents the fast-paced and dynamic world of the stock market. Perfect for presentations and reports related to finance, investments, and economics, this icon will add a professional touch to your slides and help your audience visualize complex concepts with ease.
-
 Stock Market Analysis Graph Illustration
This brightly coloured PowerPoint icon features a bold design that represents the fast-paced and dynamic world of the stock market. Perfect for presentations and reports related to finance, investments, and economics, this icon will add a professional touch to your slides and help your audience visualize complex concepts with ease.
-
 Artificial Intelligence Customer Behavior Analysis Illustration
This brightly coloured PowerPoint icon represents the implementation of machine learning in marketing. With its eye-catching design, it symbolizes the use of advanced technology to optimize marketing strategies and drive business success. Use this icon to showcase the integration of machine learning in your marketing presentations and materials
-
 Customer Retention Rate Illustration
Enhance your business presentations with our Customer Lifetime Value Key Statistics PowerPoint icon. This eye-catching icon features a bold and colourful design that will grab your audiences attention. Use it to showcase important data and statistics related to customer lifetime value, and impress your clients with your professionalism and expertise.
-
 Skillful Business Management Expert Illustration
Enhance your business strategy with our eye-catching PowerPoint icon on Benefits of Price Segmentation. This vibrant icon illustrates the advantages of targeting different customer segments with varying prices, helping businesses increase revenue and maximize profits. Perfect for presentations and reports, this icon is a must-have for any business professional.
-
 Office Staff Increase Sales And Skills Illustration
Enhance your data analysis presentations with this vibrant PowerPoint icon. Featuring a bold and modern design, this icon represents the power and efficiency of data analytics. Perfect for professionals and businesses looking to showcase their expertise in data analysis. Stand out and impress your audience with this eye-catching icon.
-
This PowerPoint layout is very helpful from a business point of view, and it's visually stunning too! I'm so happy with this product because it has helped me understand and deliver great presentations.
-
This design is not only aesthetically pleasing but it has many uses making the cost worthwhile. The graphics look stunning, and you can edit them as per your needs.
-
I looked at their huge selection of themes and designs. They appeared to be ideal for my profession. I'm sure I'll grab a few of them.
-
World-class PowerPoint designs that are fully customizable!
-
“Thanks to SlideTeam. Now I can make smart presentations in a fraction of time without any hassle.”
-
Loved the fact that SlideTeam provides clean, high-definition, and professional PowerPoint products.
-
The presentations are very helpful. I am always able to get appropriate templates for the different topics related to my profession.
-
“Immediate response, professional support, and effective solutions that were customized and immediately provided. Well done- Thank you!”
-
I had them make a presentation for an office retirement party. They were very helpful in understanding what we wanted and delivered the perfect presentation. Highly recommended!
-
“Excellent service from the customer support team when I wanted a slide that was a bit different from those on their standard menu. Super helpful.”


