60453302 style essentials 2 financials 1 piece powerpoint presentation diagram infographic slide
Trying to spruce up a last moment presentation? All of our thousands of Percentage Cycle With Bar Graph For Financial Analysis Powerpoint Slides are only moments from making your project look its best.
You must be logged in to download this presentation.
 Impress your
 audience
Editable
of Time
PowerPoint presentation slides
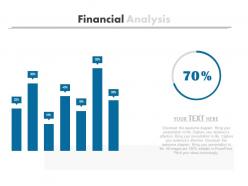
Presenting percentage cycle with bar graph for financial analysis powerpoint slides. This Power Point template slide has been crafted with graphic of percentage cycle and bar graph. This PPT slide contains the concept of financial analysis. Use this PPT slide for business and finance related presentations.
60453302 style essentials 2 financials 1 piece powerpoint presentation diagram infographic slide with all 4 slides:
Discover a new world with our Percentage Cycle With Bar Graph For Financial Analysis Powerpoint Slides. Take your thoughts on a journey of exploration.
-
I discovered this website through a google search, the services matched my needs perfectly and the pricing was very reasonable. I was thrilled with the product and the customer service. I will definitely use their slides again for my presentations and recommend them to other colleagues.
-
Understandable and informative presentation.


