28908029 style concepts 1 growth 3 piece powerpoint presentation diagram infographic slide
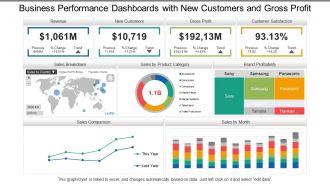
Plan with us and enlighten folks on prejudice through our, business performance dashboards snapshot with new customers and gross profit. The stages are shown here in the PPT design, filled with charts and graphs, bar and rating graphs, maps and text to reflect on your business performance. Validate your plans and explain the techniques on how these goals can be achieved, and the time frame that these goals need to be accomplished. Use the text areas to organize your data according to the plan. Here at SlideTeam, we are continuously endeavoring on better ideas for creating better results and accompanying a step to step with the market and rivals, our PPT slide reflects the same. Chalk out your future course of action with our Business Performance Dashboards With New Customers And Gross Profit. Elaborate on how you intend to go about it.
You must be logged in to download this presentation.
 Impress your
 audience
Editable
of Time
PowerPoint presentation slides
Presenting, business performance dashboards Snapshot with new customers and gross profit PowerPoint ideas for your ease. Information based slides, creating an impact on the viewer, can be used by specialists from any background, entrepreneurs, and scholars. Engaging and editable font style, type, text design and the content of the icons or the PPT slides. Full-screen view choice available and can be transformed into the desired format. Compatible with Google Slides. Open in widescreen size 16:9 after downloading.
Content of this Powerpoint Presentation
Description:
The provided image is a comprehensive business performance dashboard on a PowerPoint slide. It showcases key financial metrics such as Revenue, New Customers, Gross Profit, and Customer Satisfaction, all crucial for assessing a company's performance. The dashboard includes a map for sales distribution, a pie chart for sales by product category, a treemap for brand profitability, and a line graph for sales comparison over time. This visual representation of data is designed to offer a clear, at-a-glance understanding of the business's health, highlighting areas of growth and those needing attention.
Use Cases:
This performance dashboard is versatile and can be effectively used across various industries for tracking and presenting essential business metrics.
1. Retail:
Use: Monitoring sales performance and customer acquisition trends
Presenter: Business Analyst
Audience: Executives, Store Managers
2. E-commerce:
Use: Analyzing product category sales and brand performance online
Presenter: E-commerce Manager
Audience: Marketing Team, Sales Department
3. Manufacturing:
Use: Evaluating production efficiency and profitability by brand
Presenter: Plant Manager
Audience: Production Supervisors, Finance Team
4. Telecommunications:
Use: Assessing customer satisfaction and profit trends
Presenter: Chief Operating Officer
Audience: Customer Service Managers, Stakeholders
5. Healthcare:
Use: Tracking patient acquisition and revenue from services
Presenter: Healthcare Administrator
Audience: Department Chiefs, Financial Officers
6. Financial Services:
Use: Displaying customer growth and profitability of financial products
Presenter: Market Analyst
Audience: Investment Team, Account Managers
7. Automotive:
Use: Comparing sales trends and satisfaction across different car brands
Presenter: Sales Director
Audience: Dealership Owners, Marketing Team
28908029 style concepts 1 growth 3 piece powerpoint presentation diagram infographic slide with all 6 slides:
Brainstorm with the best with our Business Performance Dashboards Snapshot With New Customers And Gross Profit. You will get their exclusive attention.
No Reviews


