74675321 style essentials 2 compare 2 piece powerpoint presentation diagram infographic slide
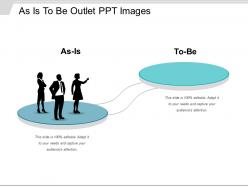
Elucidate the relationship between the expectation and reality with this As Is To Be Outlet PPT Images PowerPoint presentation. Employ this Performance analysis PPT diagram to create a balance between the current and future state of affairs of your organization. This process improvement PPT template will assist you in determining, documenting and improving the difference between business requirements and current capabilities. Take advantage of this process mapping PPT slideshow to enable optimal allocation and integration of the inputs (resources) and the current allocation-level. This performance analysis presentation will further reveal the areas that can be improved to maximize the viability of the analysis process. You can add a fishbone diagram to this Structuring AS-IS process presentation for the root analysis and identification of improvement opportunities. Hence, create an awesome presentation with the help of this Current and future state analysis PPT template and take your business to its peak level.
You must be logged in to download this presentation.
 Impress your
 audience
Editable
of Time
PowerPoint presentation slides
Presenting As Is To Be Outlet PPT Images. This presentation template is professionally designed and is easily editable in PowerPoint. Font type, font size, colors of the diagram, and background color can be altered according to the requirement. Having full compatibility with Google Slides, it can also be saved in multiple image formats such as JPG, PNG or document formats such as PDF without any problem. High-quality graphics ensure that there is no room for distortion.
74675321 style essentials 2 compare 2 piece powerpoint presentation diagram infographic slide with all 5 slides:
-
Designs have enough space to add content.
-
Excellent design and quick turnaround.


